

Required permission:
- Add dashboard (to use Create widget; without it, clicking it says You don’t have permission)
- Edit dashboard (to edit the dashboard, save the widget on it, and use Edit query)
Create a widget
- Open the dashboard and click Edit.
- Click Add, then open the Custom tab.
- Click Create widget, the first tile in the tab.
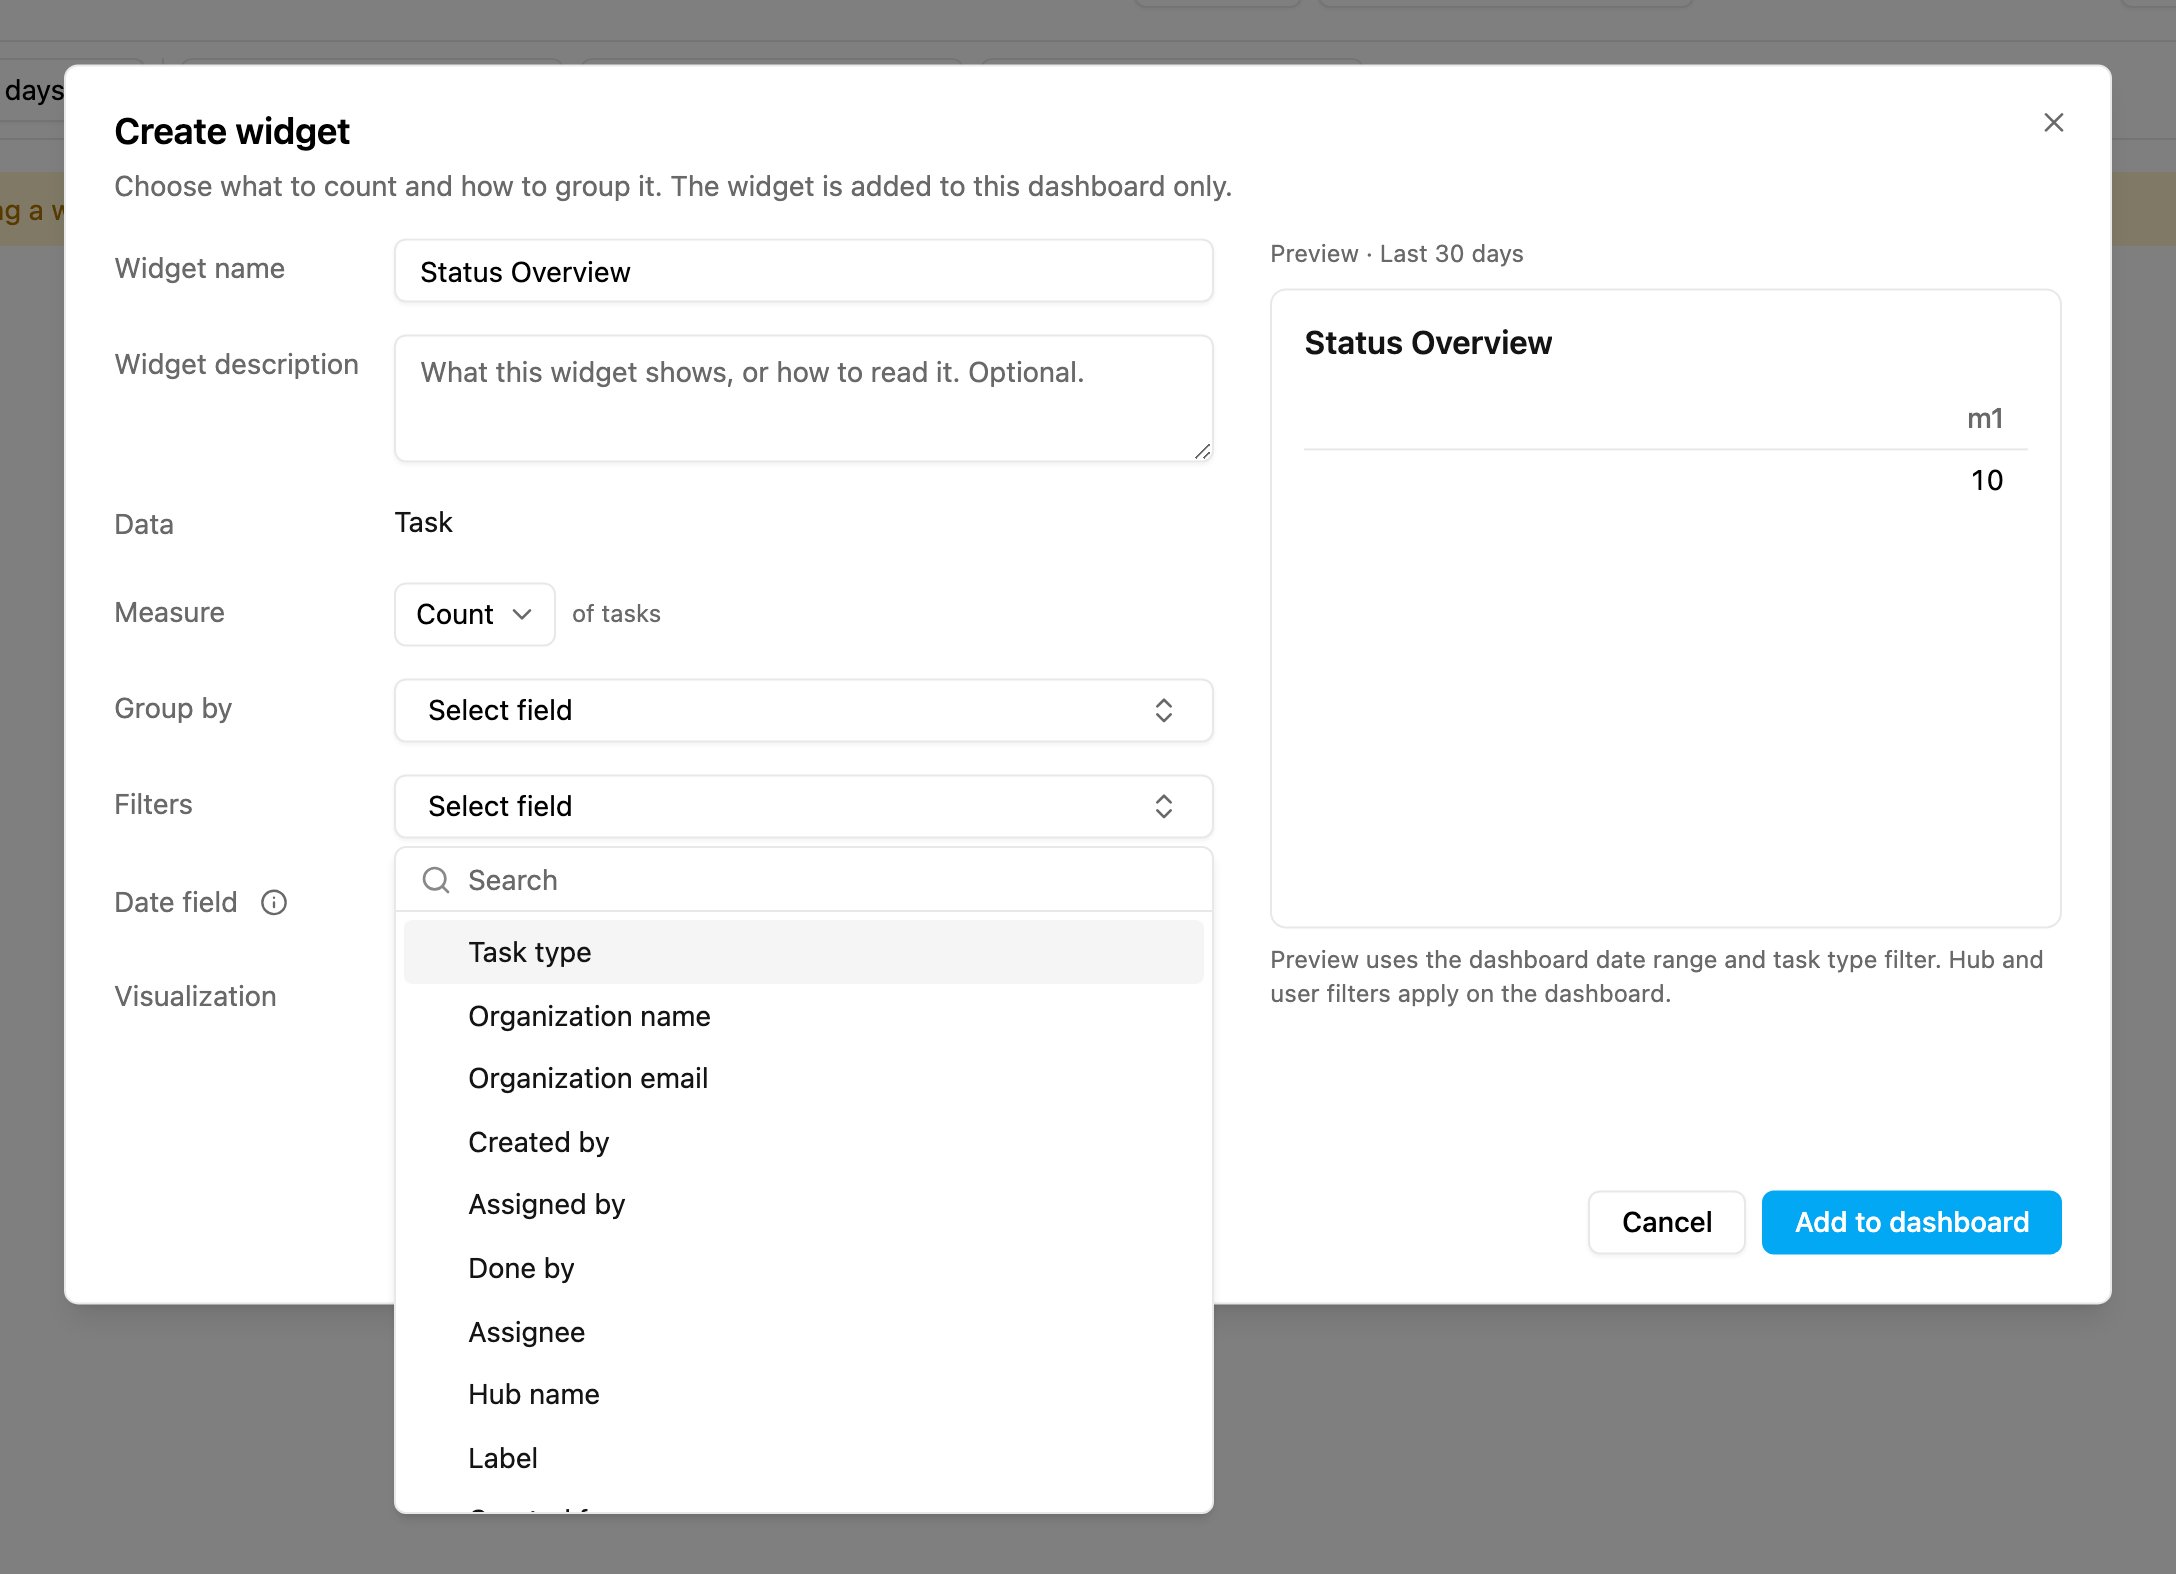
The Create widget dialog: one empty grouping row and one empty filter row, with Task type offered as a filter field.
- Widget name: the title on the widget. Required, up to 200 characters.
- Widget description: up to 500 characters. Optional. It shows in a tooltip on the info icon next to the widget title. Text that is too long is refused with a message when you click Add to dashboard.
- Data: always Task. A widget reads all your tasks unless you narrow it with a filter.
- Measure: what to count. Count counts tasks. Distinct count, Average, Sum, Minimum and Maximum ask for a Field as well.
- Group by: the dialog opens with one empty grouping row. Pick a field to split the result; once the row is filled, Add grouping appears for a second one (two at most). A field such as Hub name has a Number of groups (Top 5, Top 10, Top 20 or Top 50). A date field has an Interval: Per hour, Per day, Per week or Per month. Remove a grouping with ×. An empty row is ignored.
- Filters: optional. The dialog opens with one empty filter row; once it is filled, Add filter appears for another. Use a filter to count only some tasks, for example Status is one of Done, or Task type is one of Delivery, Pickup. Remove a filter with ×. An empty row is ignored. Without a Task type filter the widget counts tasks of every task type. Only task types of your organization are accepted.
- Date field: the date that decides which tasks fall in the time range, for example Start time or Done time. Point at the info icon next to Date field to see which range applies now.
- Visualization: how to draw the result. A visual that cannot show your settings is greyed out; point at it to see why. For example, a single number cannot show a grouped result. A new widget starts on Table.
Time range and dashboard filters
A custom widget has no time range of its own. On the dashboard it follows the dashboard’s time range and filters like any other widget. The tooltip on the Date field info icon says which range it uses now, for example The time range comes from the dashboard filter (now: Last 30 days). The dashboard’s Task Types filter is combined with the widget’s own Task type filter, if it has one. If the two have no task type in common, the widget shows its usual empty state.Preview
The Preview shows the widget with your dashboard’s current data, and updates a moment after you stop changing settings. Its first line names the time range it uses, for example Preview · Last 30 days. The preview uses the dashboard’s time range, the widget’s own filters and the dashboard’s Task Types filter. Hub and assignee filters are not used in the preview, but they apply once the widget is on the dashboard. The note under the preview says so: Preview uses the dashboard date range and task type filter. Hub and user filters apply on the dashboard.- Finish every grouping and filter to see a preview.: a grouping or filter is only partly filled, for example a filter field with no value.
- This widget’s query can’t be saved. Change or remove the widget and try again.: the settings would make the query too large, for example Per hour split by 50 hubs over a month. The setting to change is marked Check this setting. Pick a larger interval or fewer groups.
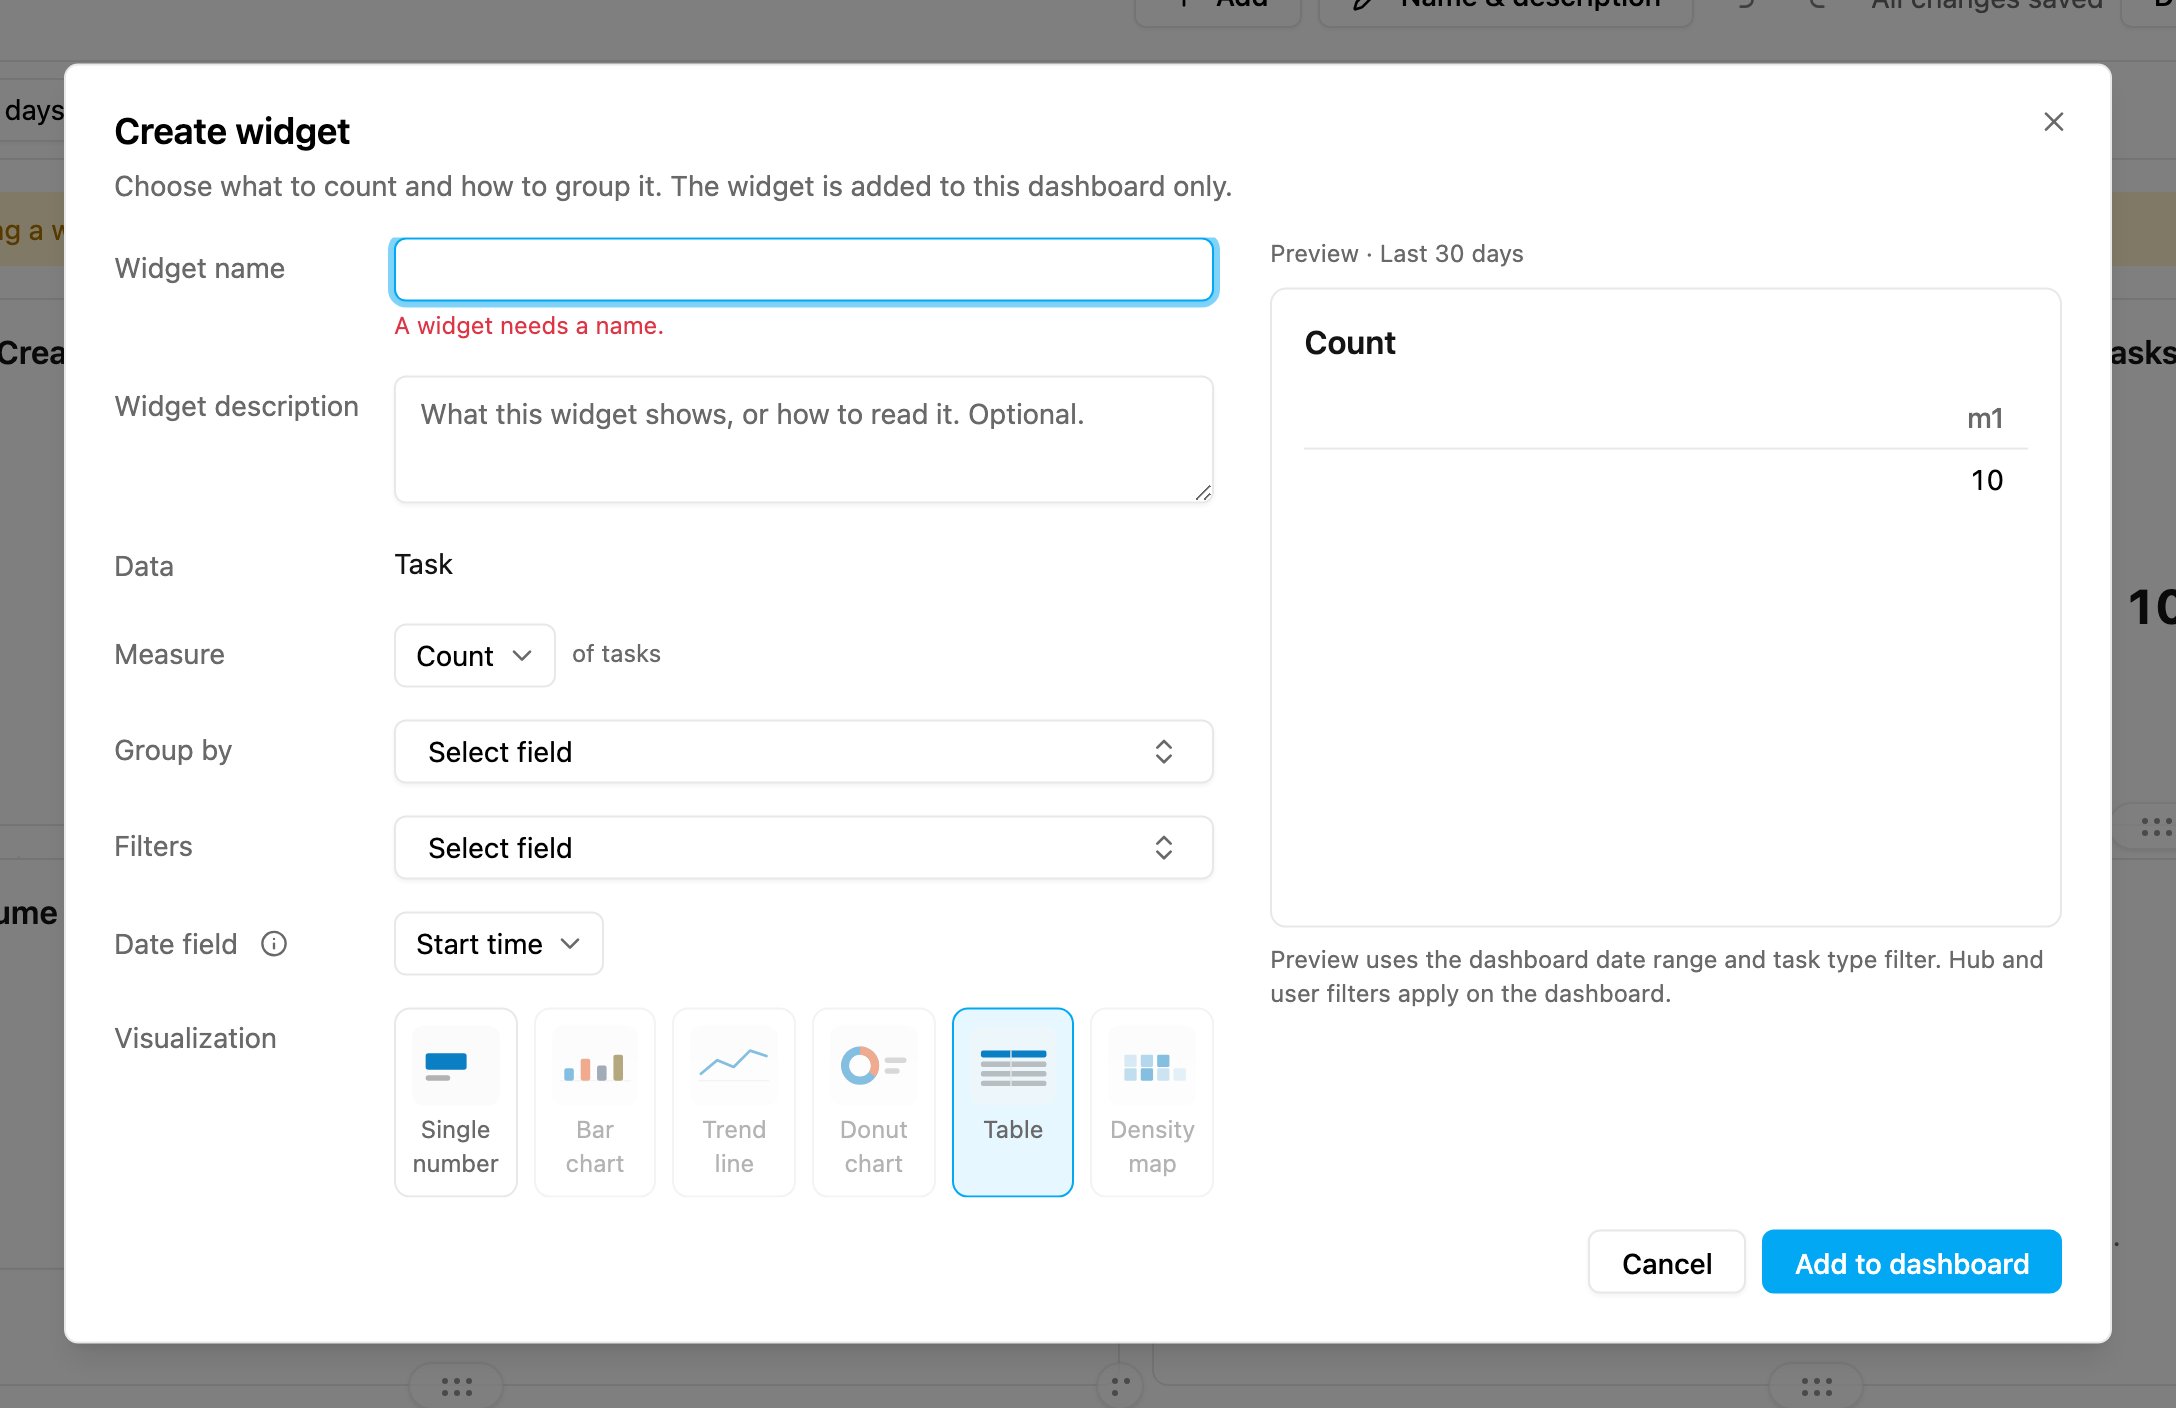
Clicking Add to dashboard with no name marks the field: A widget needs a name.
Edit a widget’s query
You can change what a widget counts, not just its name.- In edit mode, click the widget’s ⋯ and choose Edit query.
- The Edit widget query dialog opens with the widget’s current settings and its saved visual.
- Change what you need and click Apply changes.
- Click Save to keep the change, or Discard to drop it.