

Required permission:
- View dashboard
- Add dashboard (to create or duplicate a dashboard)
- Edit dashboard (to change widgets, filters, name and sharing)
- Delete dashboard (to delete a dashboard)
The dashboard list
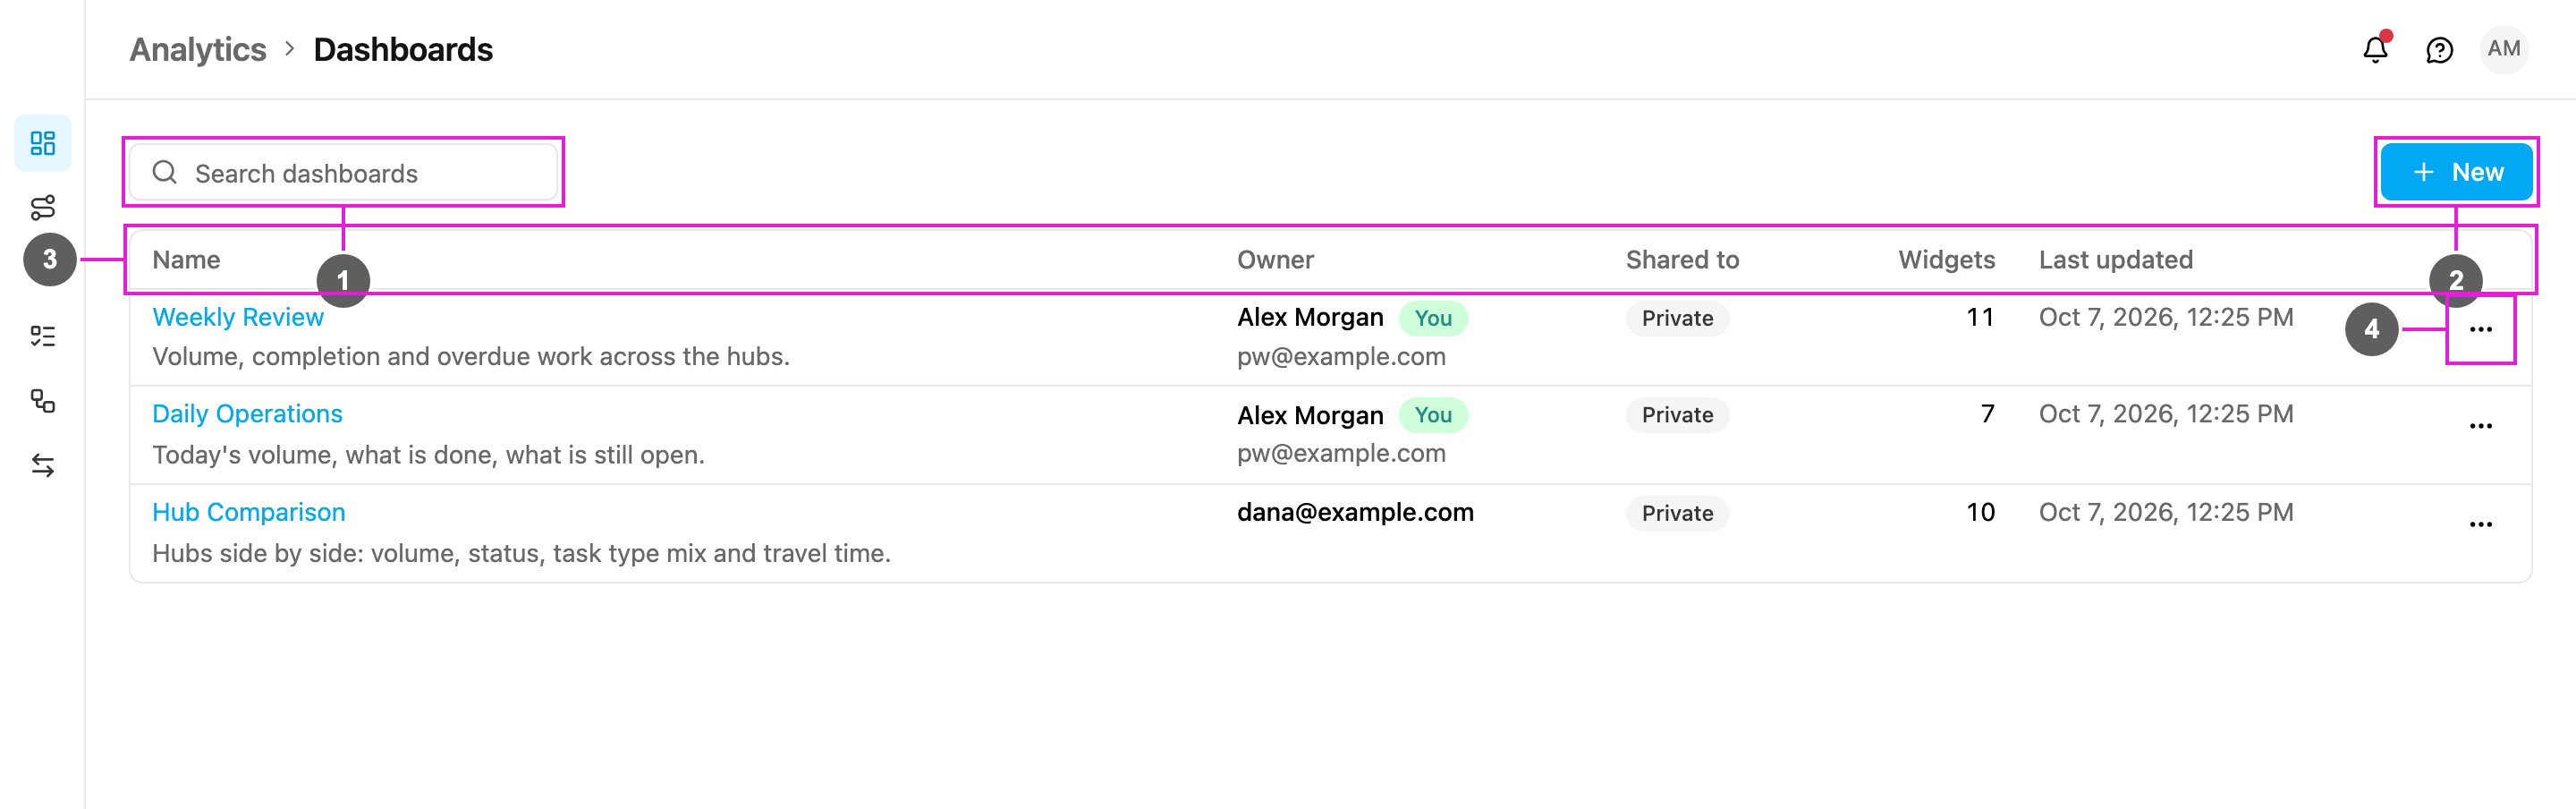
- Search dashboards: find a dashboard by name.
- New: create a dashboard from a template. See Dashboard Templates.
- Table: every dashboard you own or that is shared with your role.
- ⋯: the actions for one dashboard.
If nothing matches the search, the list says No dashboard matches. With no dashboards at all it says No dashboards yet and invites you to start from a template.
Dashboard actions
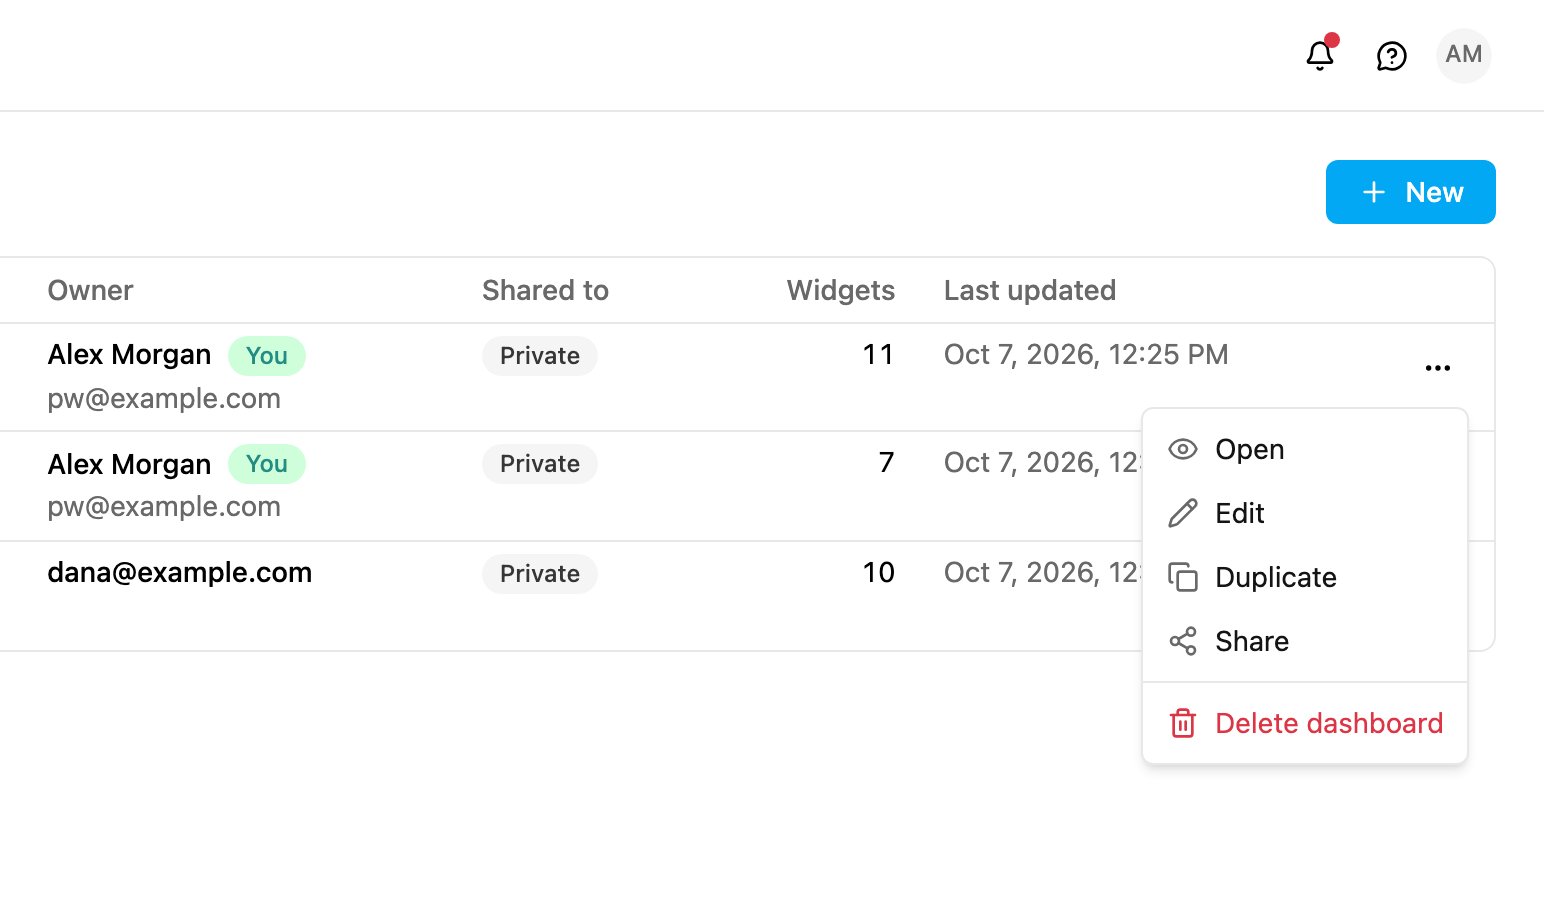
- Open: show the dashboard.
- Edit: open the dashboard in edit mode. See Editing a Dashboard.
- Duplicate: make your own private copy. The copy is never shared, even when the original is.
- Share: choose the roles that can open it. See Sharing a Dashboard.
- Delete dashboard: remove the dashboard and its layout for everyone it is shared with. This can’t be undone.
Reading a dashboard
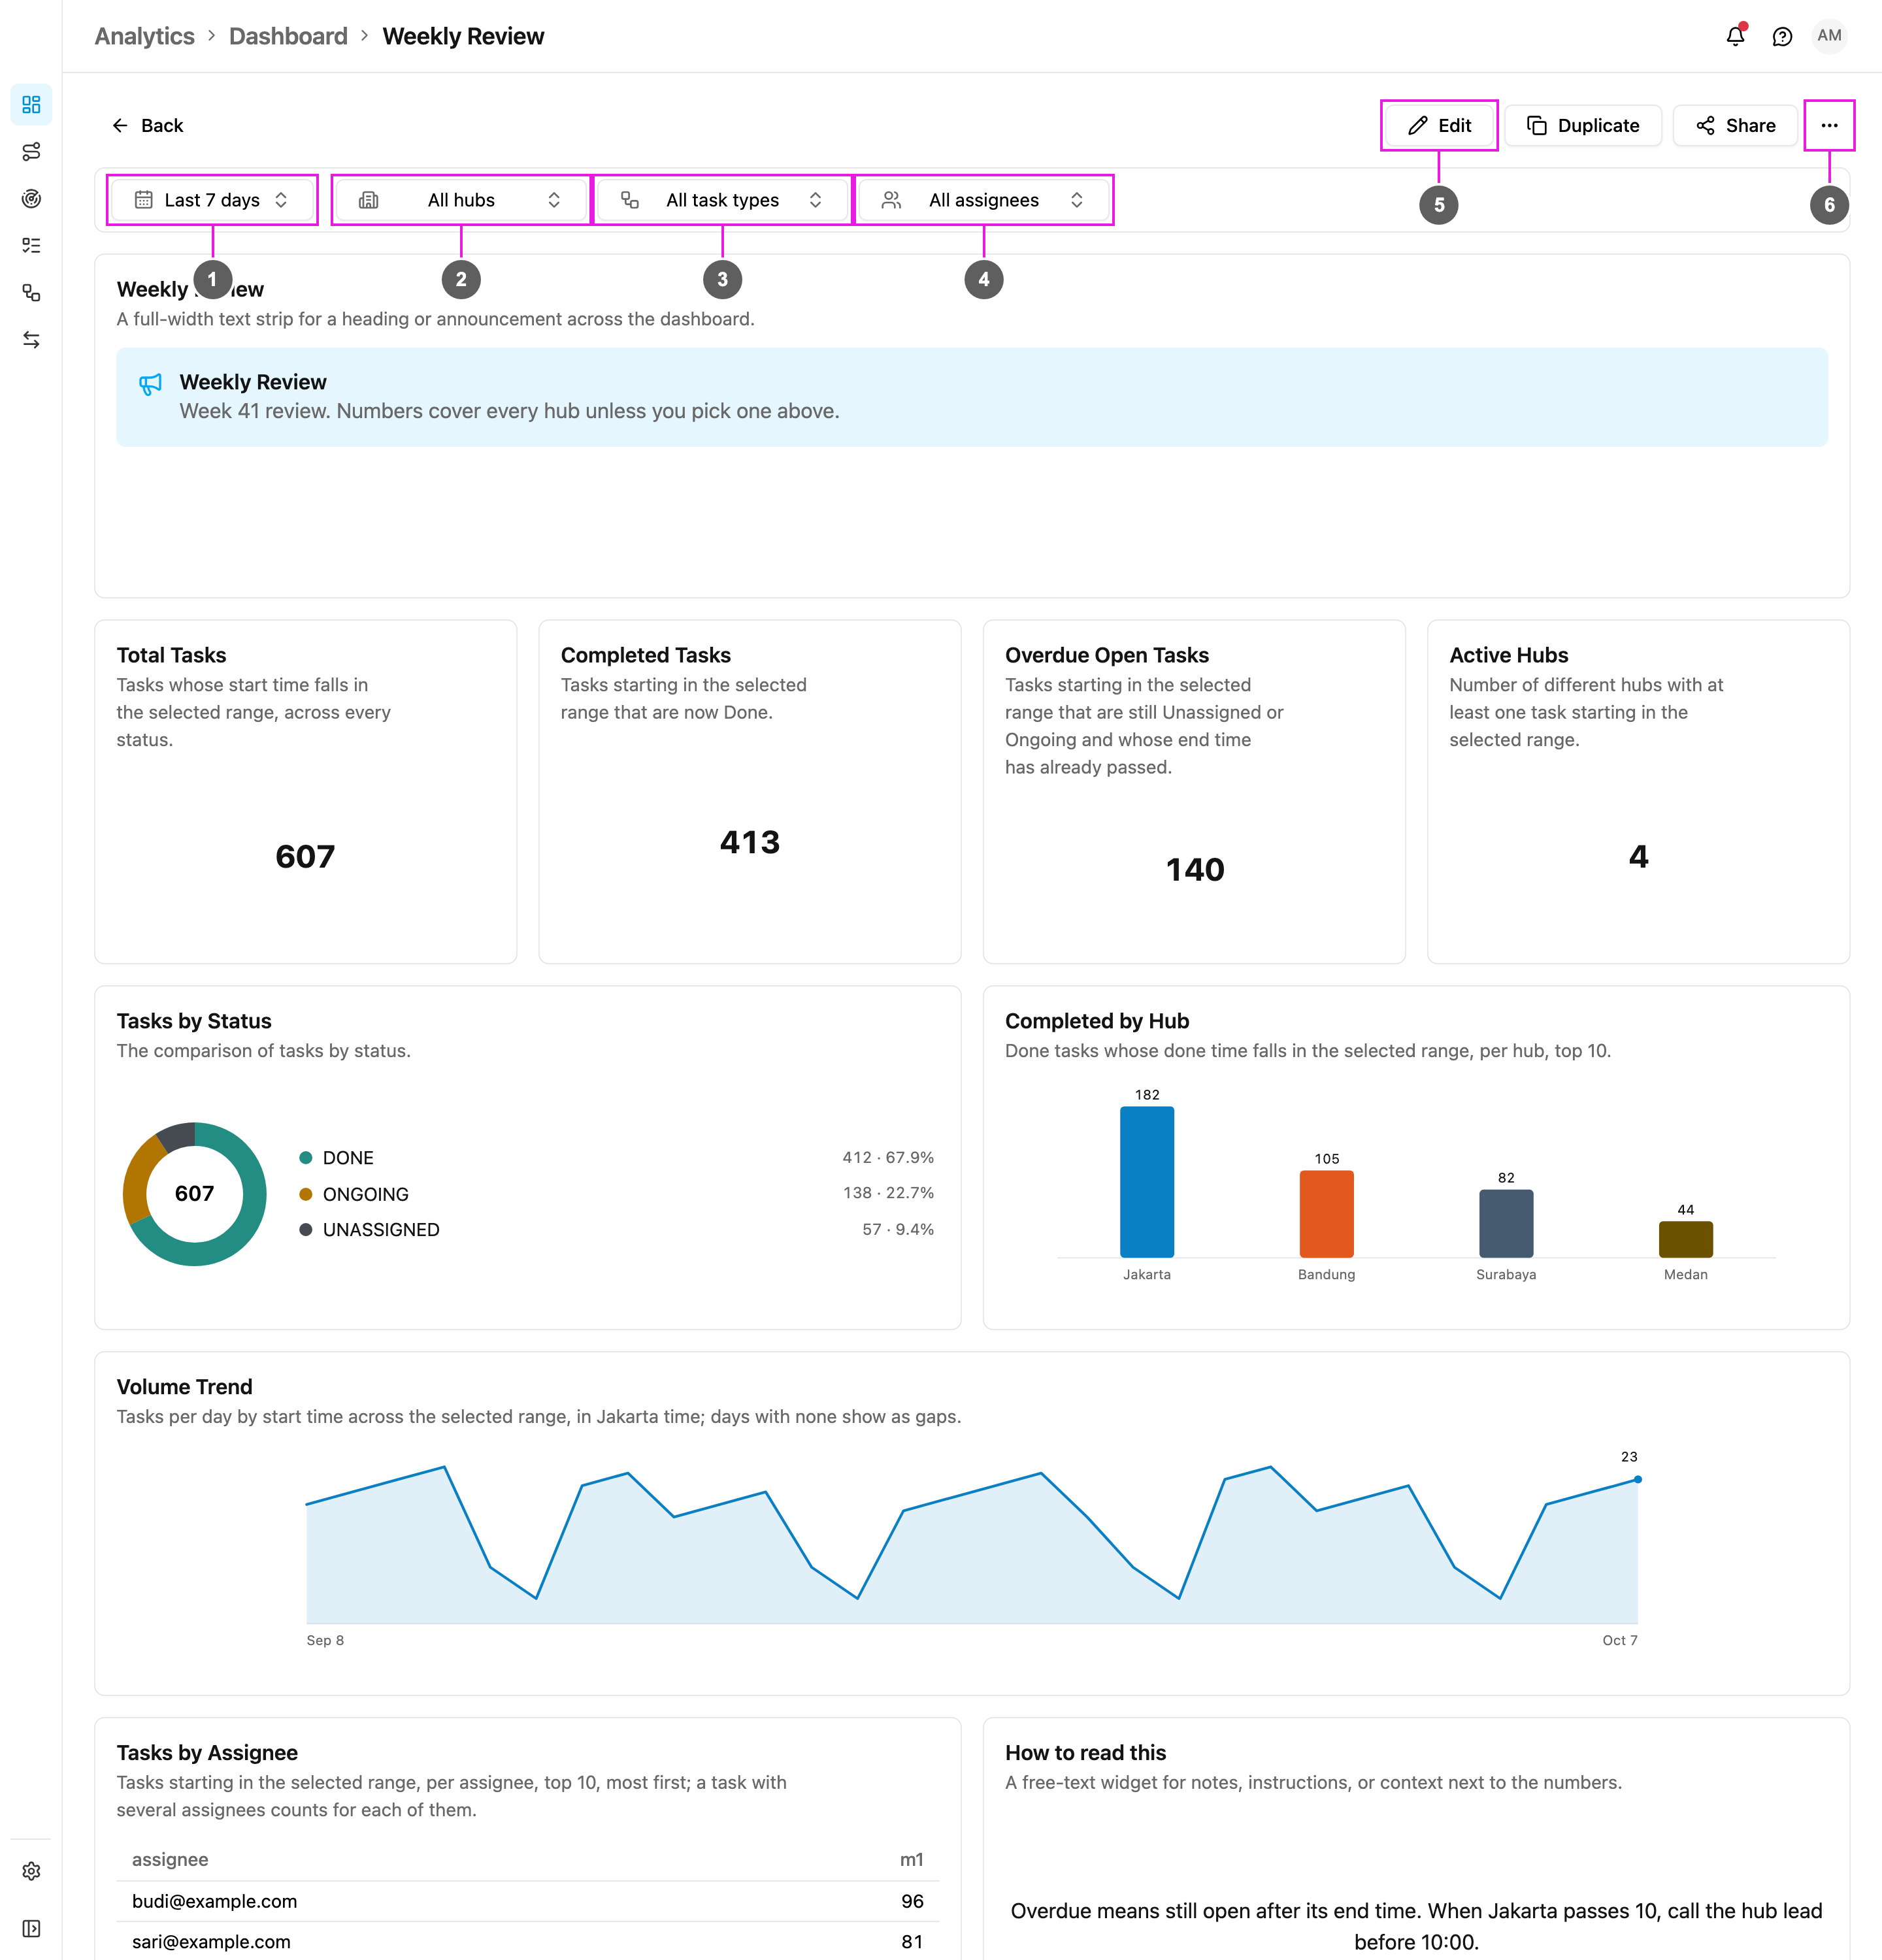
- Time range: the period every widget counts. The default is Last 30 days.
- Hubs: All hubs, or one or more hubs.
- Task Types: All task types, or one or more task types.
- Assignees: All assignees, or one or more people.
- Edit: change the widgets. Duplicate and Share sit beside it.
- More dashboard actions: Delete dashboard.
Filters
The four filters at the top apply to every widget at once.Time range
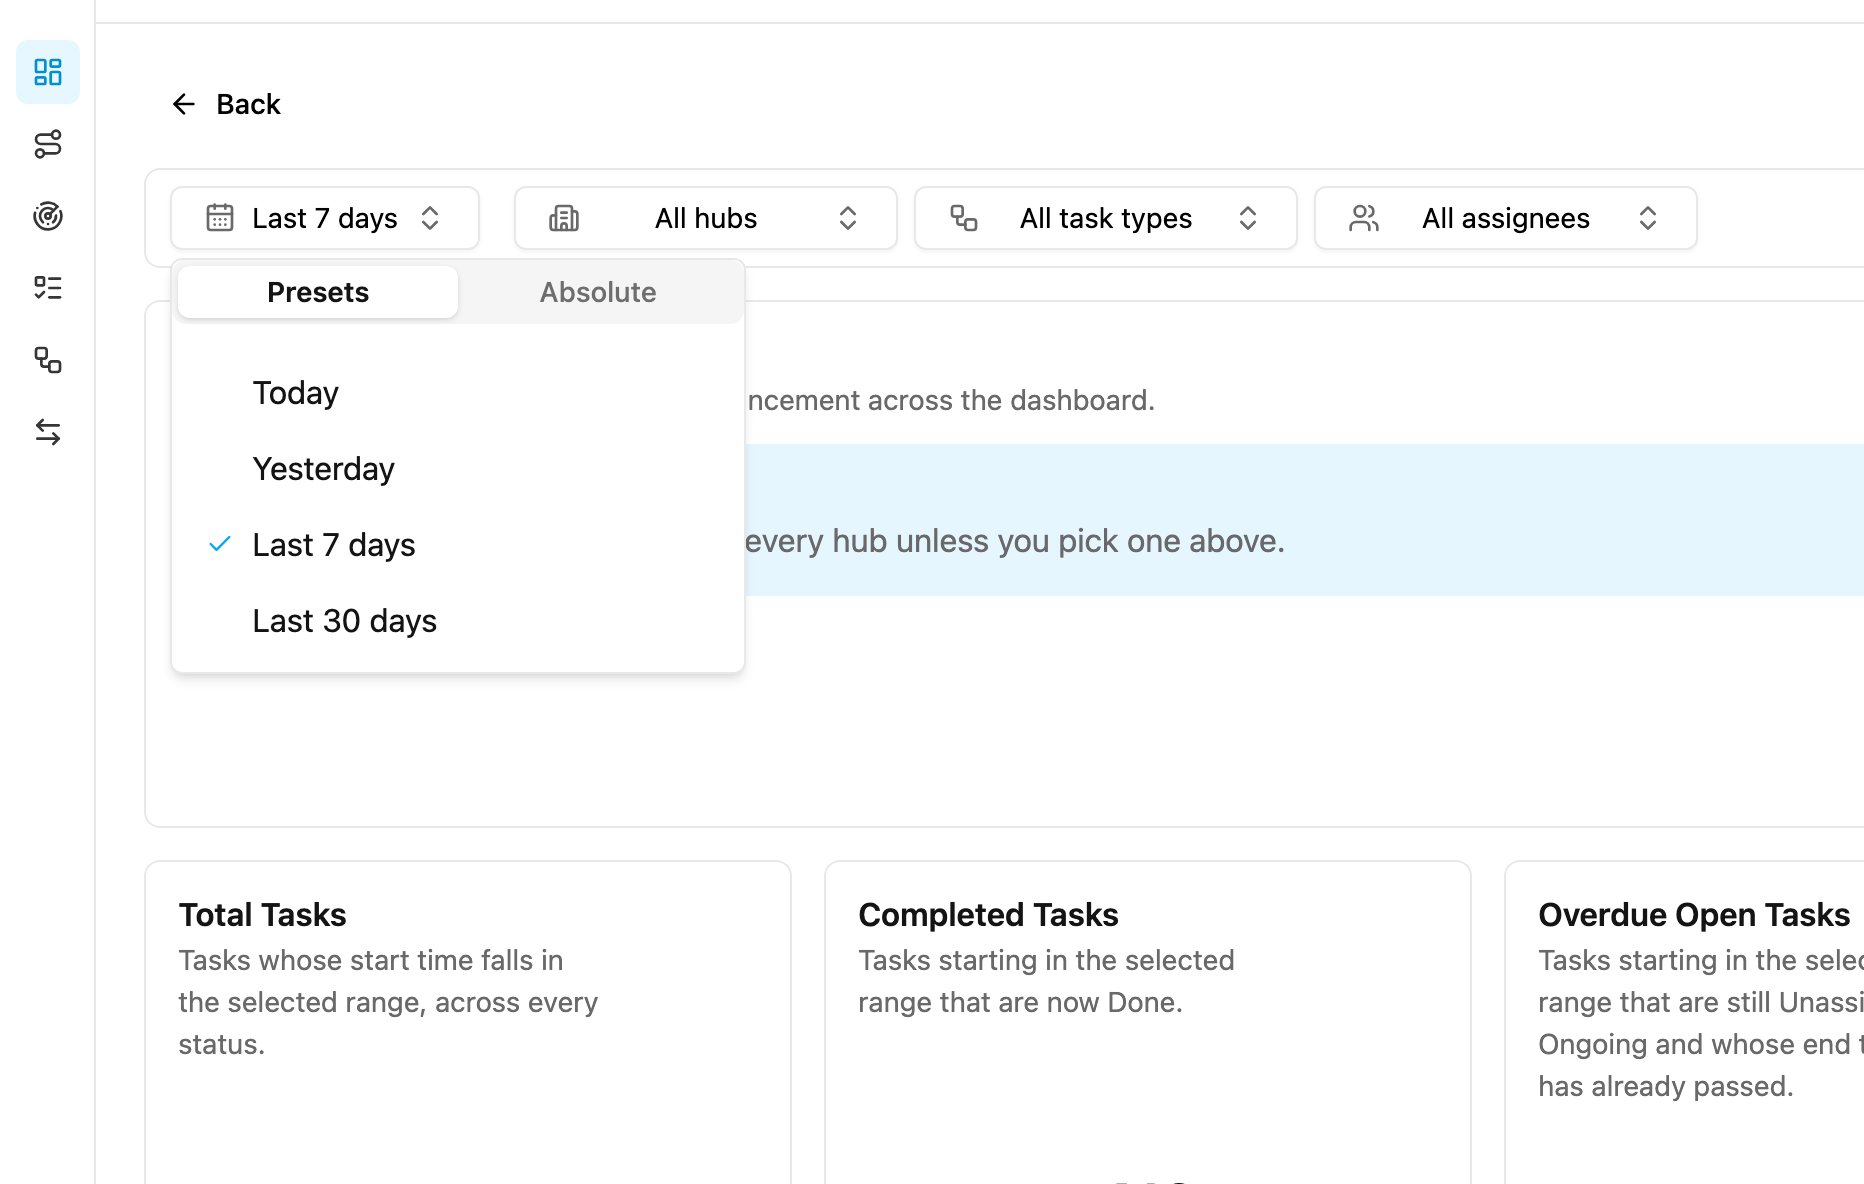
- Presets: Today, Yesterday, Last 7 days or Last 30 days.
- Absolute: pick a From and To date and click Apply. A custom range can be at most 31 days, counting both the first and the last day: 1–31 January fits, 1 January – 1 February doesn’t.
Hubs, task types and assignees
- Hubs: choose one or more hubs. The list shows only the hubs you have access to, and All hubs means all of them. Changing the hubs keeps your task type and assignee filters.
- Task Types: choose one or more task types. Empty means every task type.
- Assignees: choose one or more people. Empty means everyone.
Filters are kept in the address
Every filter you choose is written into the page address. Copy the address to send someone exactly the view you are looking at, or bookmark it. When the filters differ from what the dashboard saved, a Reset filters button brings back the dashboard’s own time range and hubs and clears the task type and assignee filters. Clicking a bar or slice narrows the whole dashboard to that value, for example to one status or one hub. The page shows Filtered to … with a Clear filter button.Widget options
Hover over a widget and click ⋯ for its options.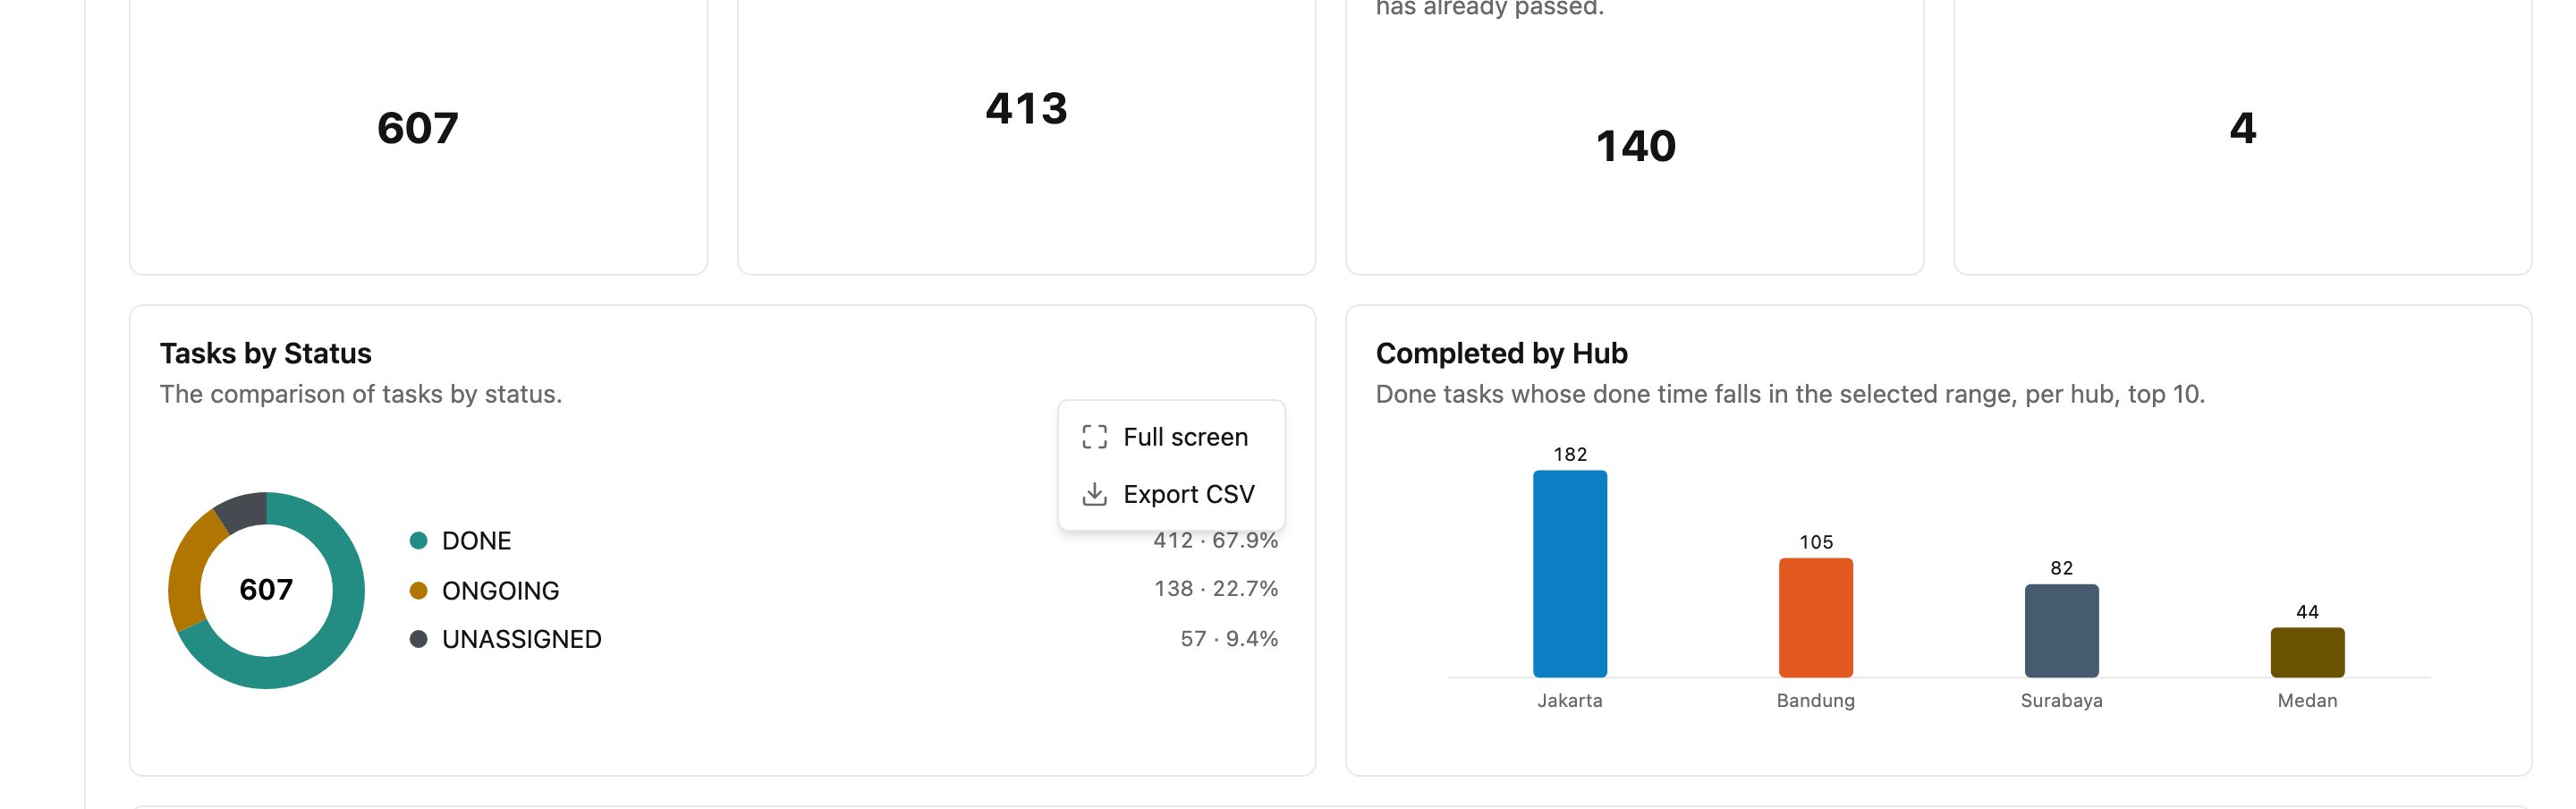
- Full screen: show the widget alone, larger.
- Export CSV: download the numbers behind the widget as a CSV file.
Widget messages
A widget that can’t load never stops the others from showing.
From the previous version
The task dashboard of the previous version had four fixed charts: Task Activity, Task by Status, User Activity and User by Status, filtered by date range (at most 30 days, by task start time), user and task type. Those four charts are now widgets, and the Default Dashboard template lays them out the same way:
The date, user and task type filters are still there, as Time range, Assignees and Task Types, and you can now also filter by hub.
In this section
- Dashboard Templates: every starting layout and what it shows.
- Dashboard Widgets: every widget you can add.
- Editing a Dashboard
- Sharing a Dashboard
- Insight: ask questions about your tasks in plain language.