> ## Documentation Index
> Fetch the complete documentation index at: https://docsv4.mile.app/llms.txt
> Use this file to discover all available pages before exploring further.
# Viewing and Exporting a Report
> Run a report on screen or download it, choosing the hubs, status, assignee and date range for that run.
Required permission:
* View report
* View task (to view a task report) or View data source (to view a data report)
* Export task (to export a task report)
## Choose the run filters
A task report asks for its filters each time you view or export it. A data report has no run filters: it opens or exports straight away.
1. Open **Analytics › Report**.
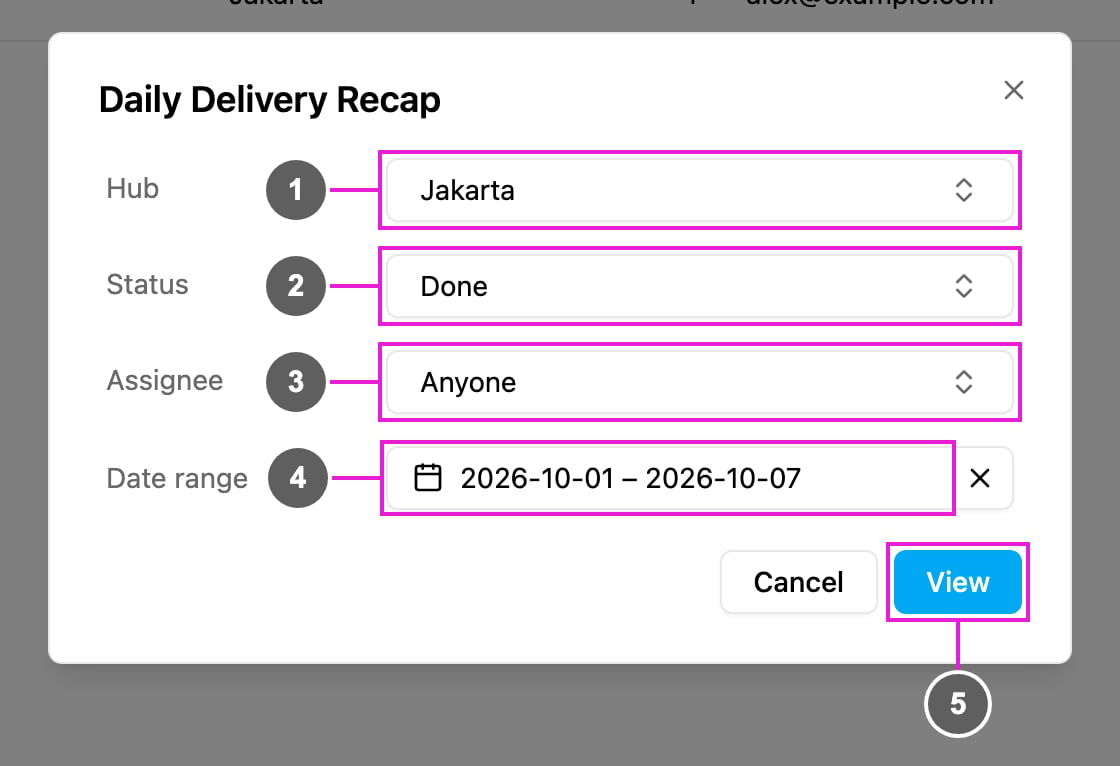
2. Click **⋯** on a task report, then **View** or **Export**. A dialog titled with the report name opens.
1. **Hub**: the hubs to include in this run. It starts with the report's hubs.
2. **Status**: the statuses to include. It starts with the report's default status.
3. **Assignee**: the people to include. **Anyone** includes every task.
4. **Date range**: the days to include. It starts with the report's default range (daily, weekly or monthly, ending today). Tasks are filtered by start time, up to 31 days. Click **×** to clear the range and pick another.
5. **View** (or **Export**): run the report with these filters.
What you pick here applies to this run only. The report's saved defaults don't change.
## View a report
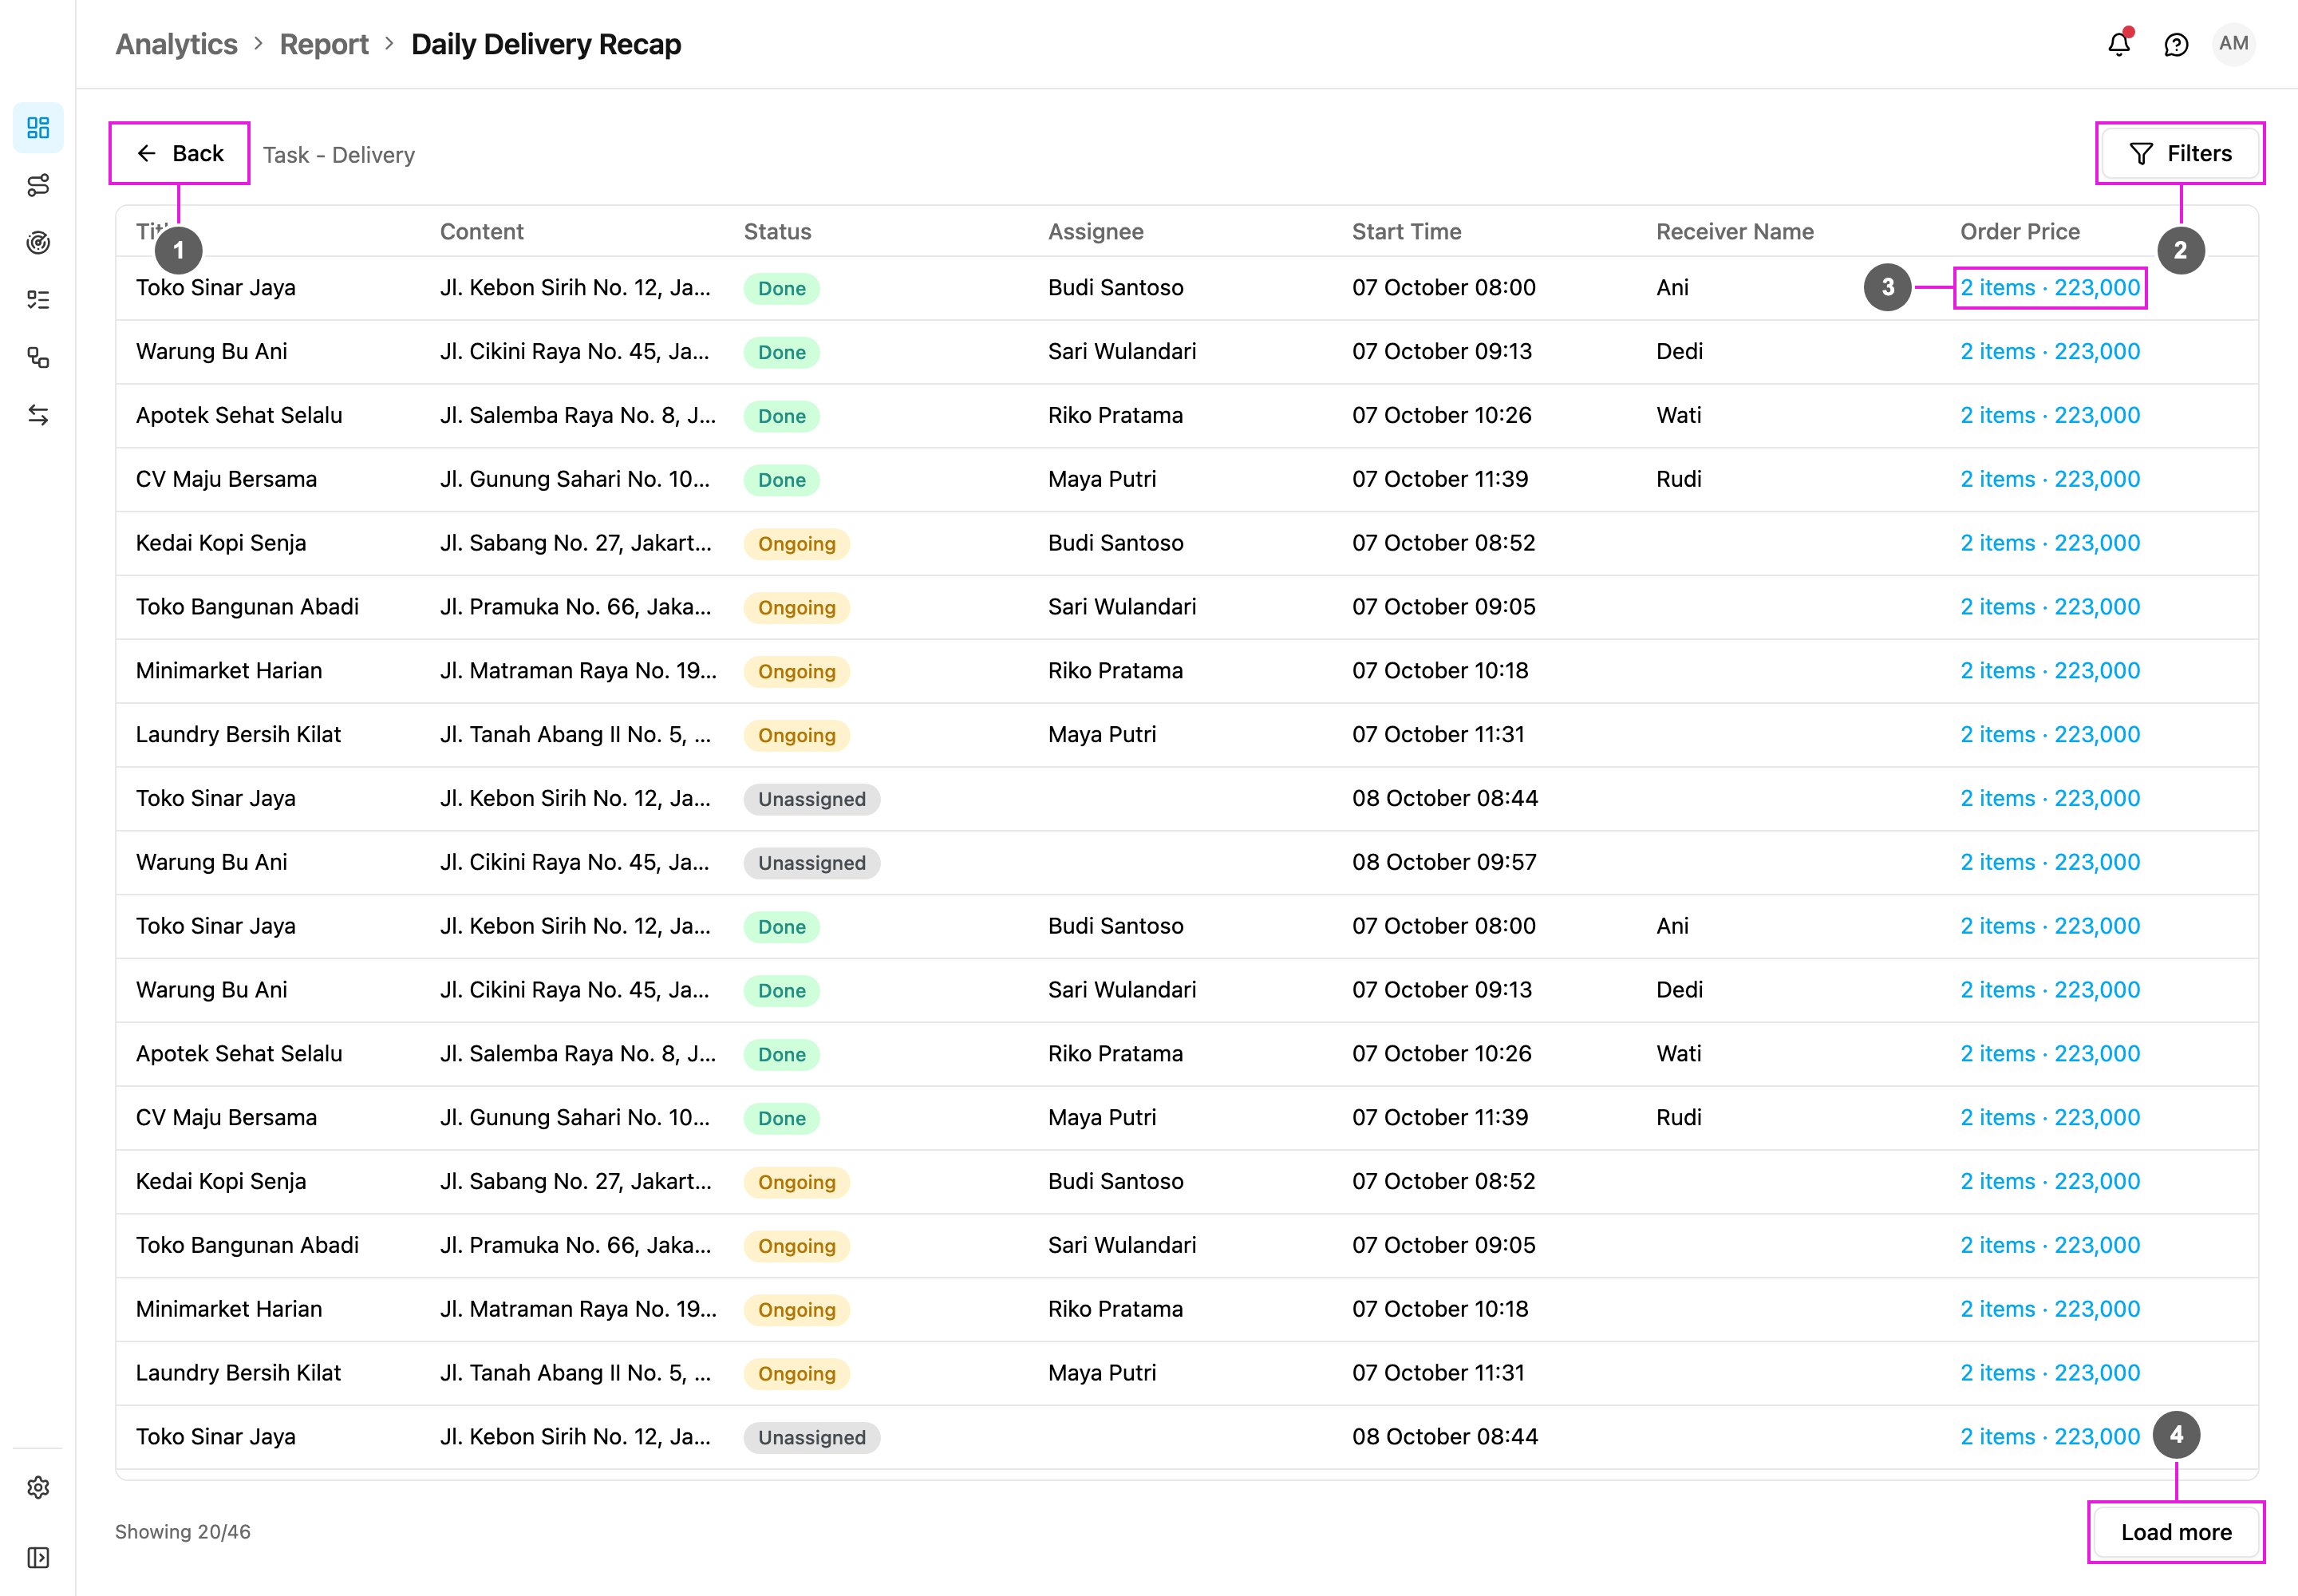
After **View**, the report opens on its own page.
1. **Back**: return to the report list.
2. **Filters** (task reports only): open the same dialog to change the hub, status, assignee or date range. The rows reload when you click **View**.
3. **Bill and list cells**: click the summary to open the full answer.
4. **Load more**: load the next 100 rows. *Showing 20/46* under the table tells you how many rows are loaded out of the total.
The title is the report name, with its report type under it. Each column of the report is one column of the table, in the report's order. Statuses show as colored badges, and the assignee column shows the person's name.
Task rows are sorted by start time and include subtasks. A data report shows the records of the report's hubs, or every record for a shared data type.
The page address carries the run filters, so you can bookmark a view or share its link with someone who can open the report.
If there are no rows for the filters, the page says *No data for this report*. If the report's task type or data type was deleted, it says *Source deleted*. If you lack the view permission for the report's data, it says *You do not have access to this report's data*.
### Bill and list details
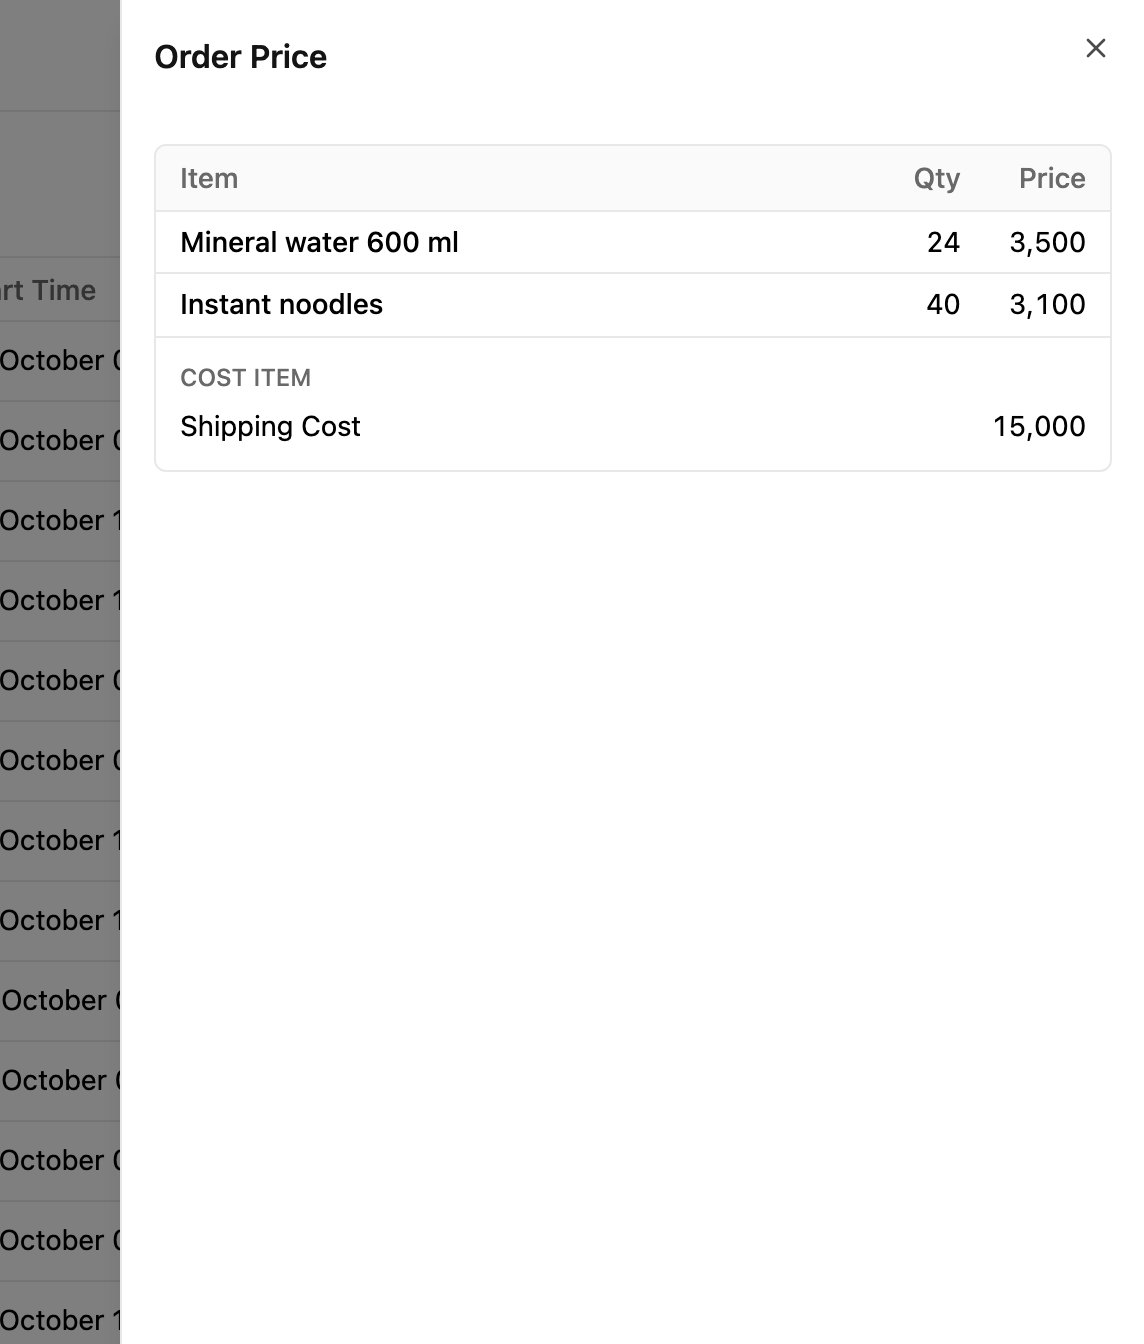
Click a bill or list cell to open its details in a side panel. A bill shows every item with its quantity and price, then its cost items. A list shows every item and whether it was checked.
## Export a report
1. Click **⋯** on the report, then **Export**.
2. For a task report, check the filters in the dialog and click **Export**. A data report starts its export right away.
3. The app says *Export data is currently being processed*, with a link **View its status on Data Export**.
The file is an Excel workbook with the report's columns in the report's order. It is built in the background, like any other export. Download it from **Export & Import › Export** when it's ready. See [Export](/pages/export-import/export).
This documentation is built and hosted on [Mintlify](https://mintlify.com), a developer documentation platform.