> ## Documentation Index
> Fetch the complete documentation index at: https://docsv4.mile.app/llms.txt
> Use this file to discover all available pages before exploring further.
# Creating a Report
> Pick a task type or data type, the hubs, the default filters and the columns, then save the report.
Required permission:
* Add report (to create a report)
* Edit report (to change a report)
## Create a report
1. Open **Analytics › Report**.
2. Click **New**. The **Create report** dialog opens.
3. Fill in the fields below, then click **Save**. The app says *Report "…" created*.
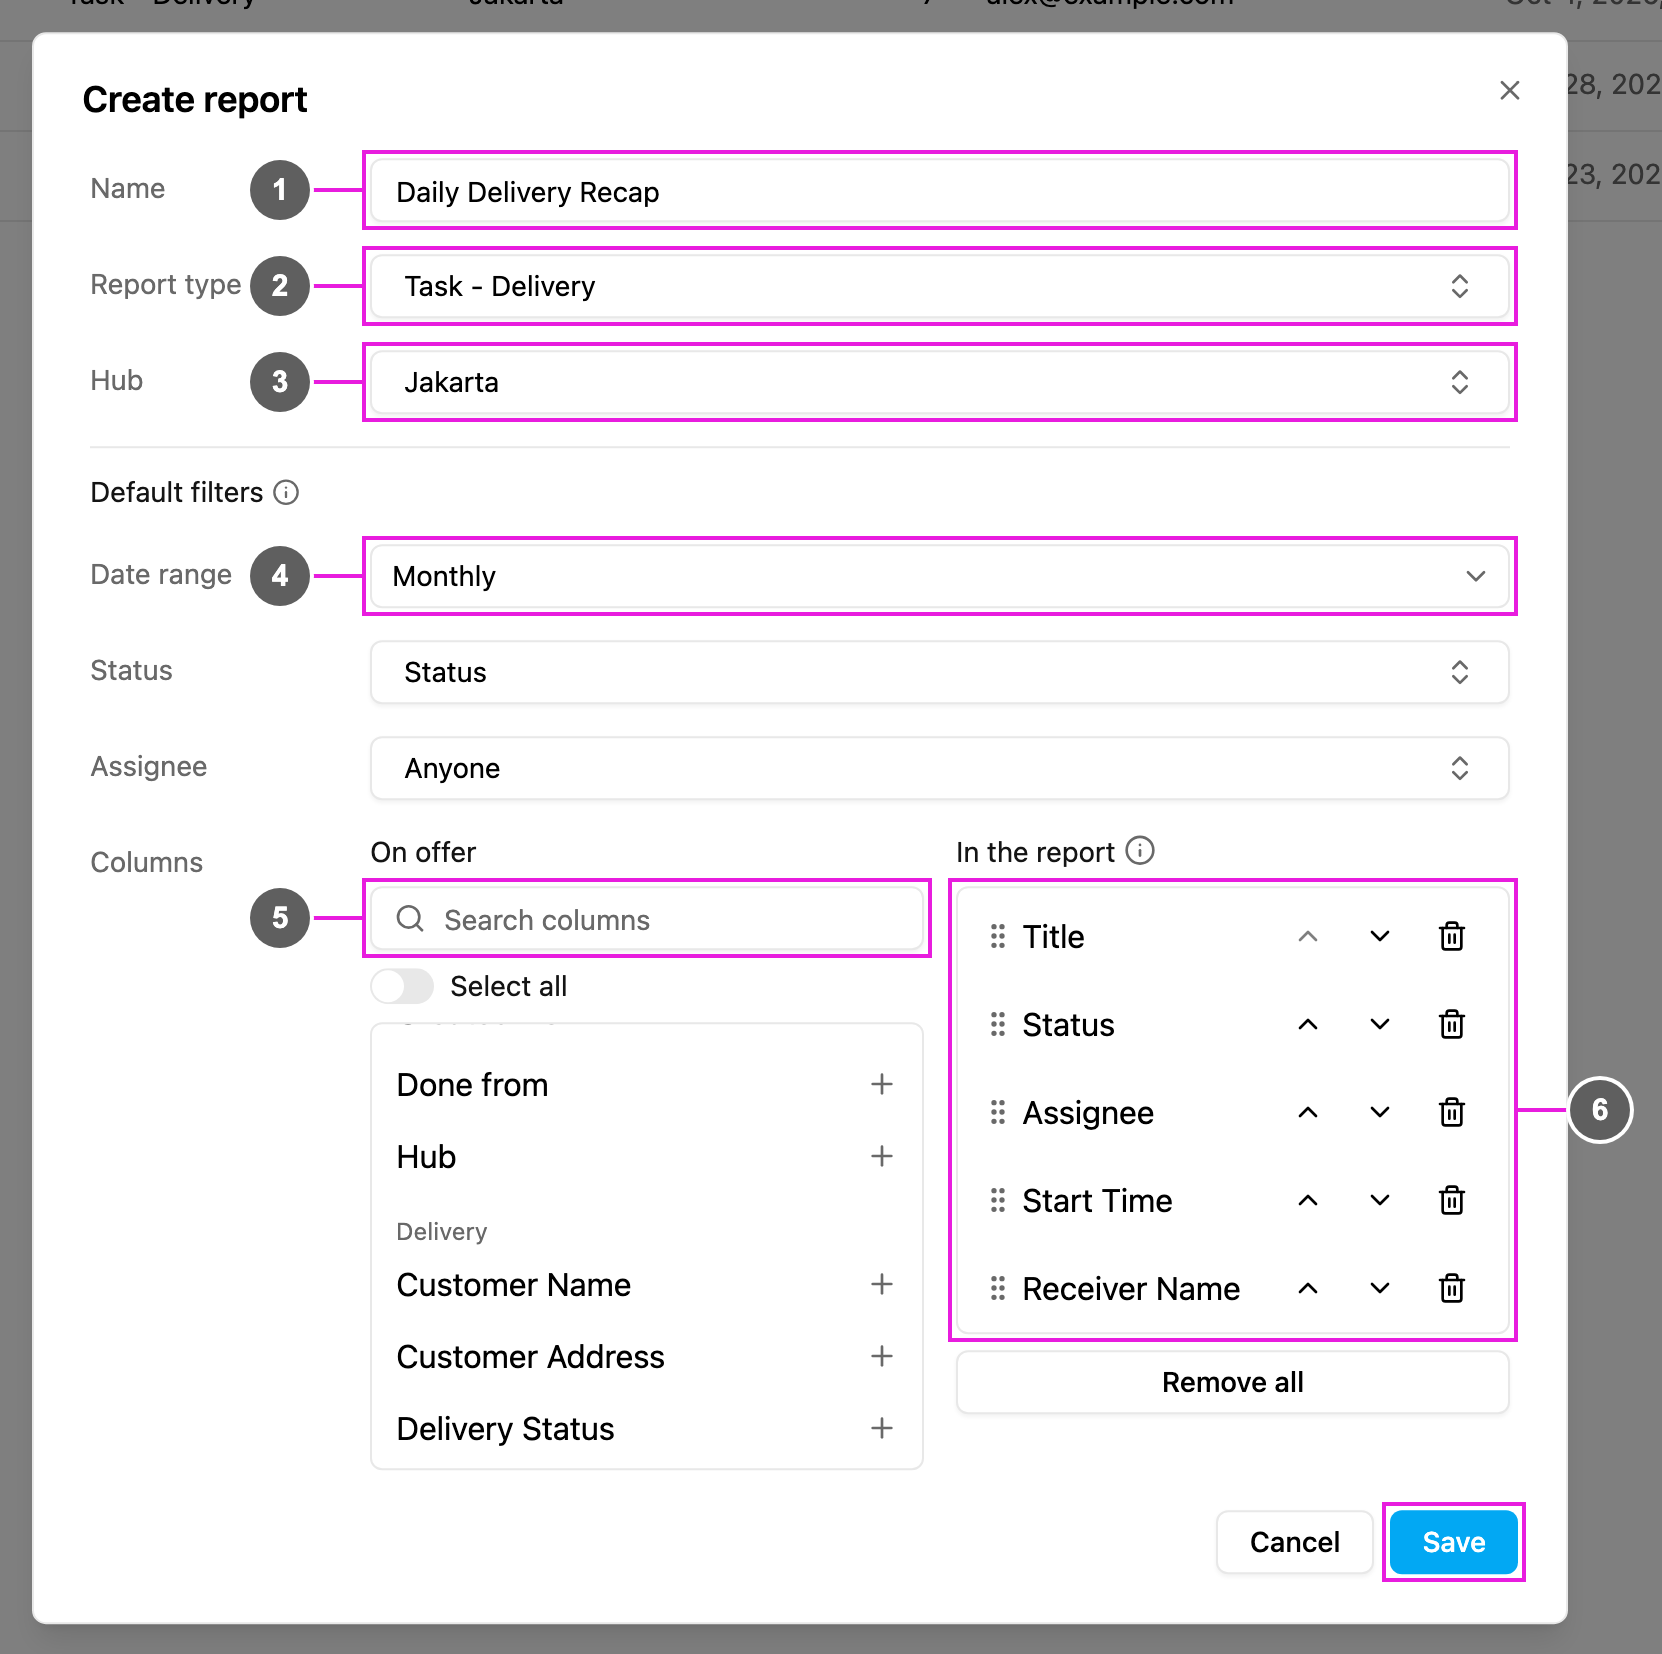
1. **Name**: the report name, for example *Daily Delivery Recap*.
2. **Report type**: the task type or data type the report reads. Task types show as *Task - Delivery*, data types as *Data - Stores*. Use the search box to find one.
3. **Hub**: the hubs whose records the report shows. Pick one or more, or use **Select all hubs**. A shared data type has no hubs, so this field is hidden for it.
4. **Default filters** (task reports only): the filters the report starts with each time it is viewed or exported. You can still change them on every run.
* **Date range**: **Daily** (today), **Weekly** (the last 7 days) or **Monthly** (the last 30 days). The range always ends today and is matched against the task's start time.
* **Status**: show only tasks with these statuses. Leave it empty to show every status.
* **Assignee**: show only tasks assigned to these people. Leave it on **Anyone** to show every task.
5. **Columns › On offer**: the columns you can add, with **Search columns** to find one and **Select all** to add every column. For a task type, **Standard Columns** (title, status, assignee, times, hub and so on) are listed first, then the fields of the task type under its name. For a data type, every field of the data type is listed. Click **+** next to a column to add it.
6. **Columns › In the report**: the columns the report shows. Top to bottom is left to right in the view and in the exported file. Drag a column by its handle, or use the up and down arrows, to change the order. Click the trash icon to remove a column, or **Remove all** to start over.
The **Columns** section appears once you pick a report type. Changing the report type clears the columns you picked.
**Save** stays disabled until the report has a name, a report type, at least one column and, when the type needs it, at least one hub.
### Which fields can be columns
Task reports offer the same fields as the task table, plus **bill** and **list** answers. A bill or list cell shows a summary (for example *2 items · 223,000*) that opens the full answer. Photos, signatures and other files aren't offered as columns.
## Edit a report
1. Click **⋯** on the report, then **Edit**.
2. The **Edit report** dialog opens with the report's current settings. Change what you need.
3. Click **Save**. The app says *Report "…" updated*.
If a field was removed from the task type or data type, it is dropped from the columns when you save.
If the report's task type or data type was deleted, the report type column says *Source deleted*. Edit the report and pick a new report type.
This documentation is built and hosted on [Mintlify](https://mintlify.com), a developer documentation platform.