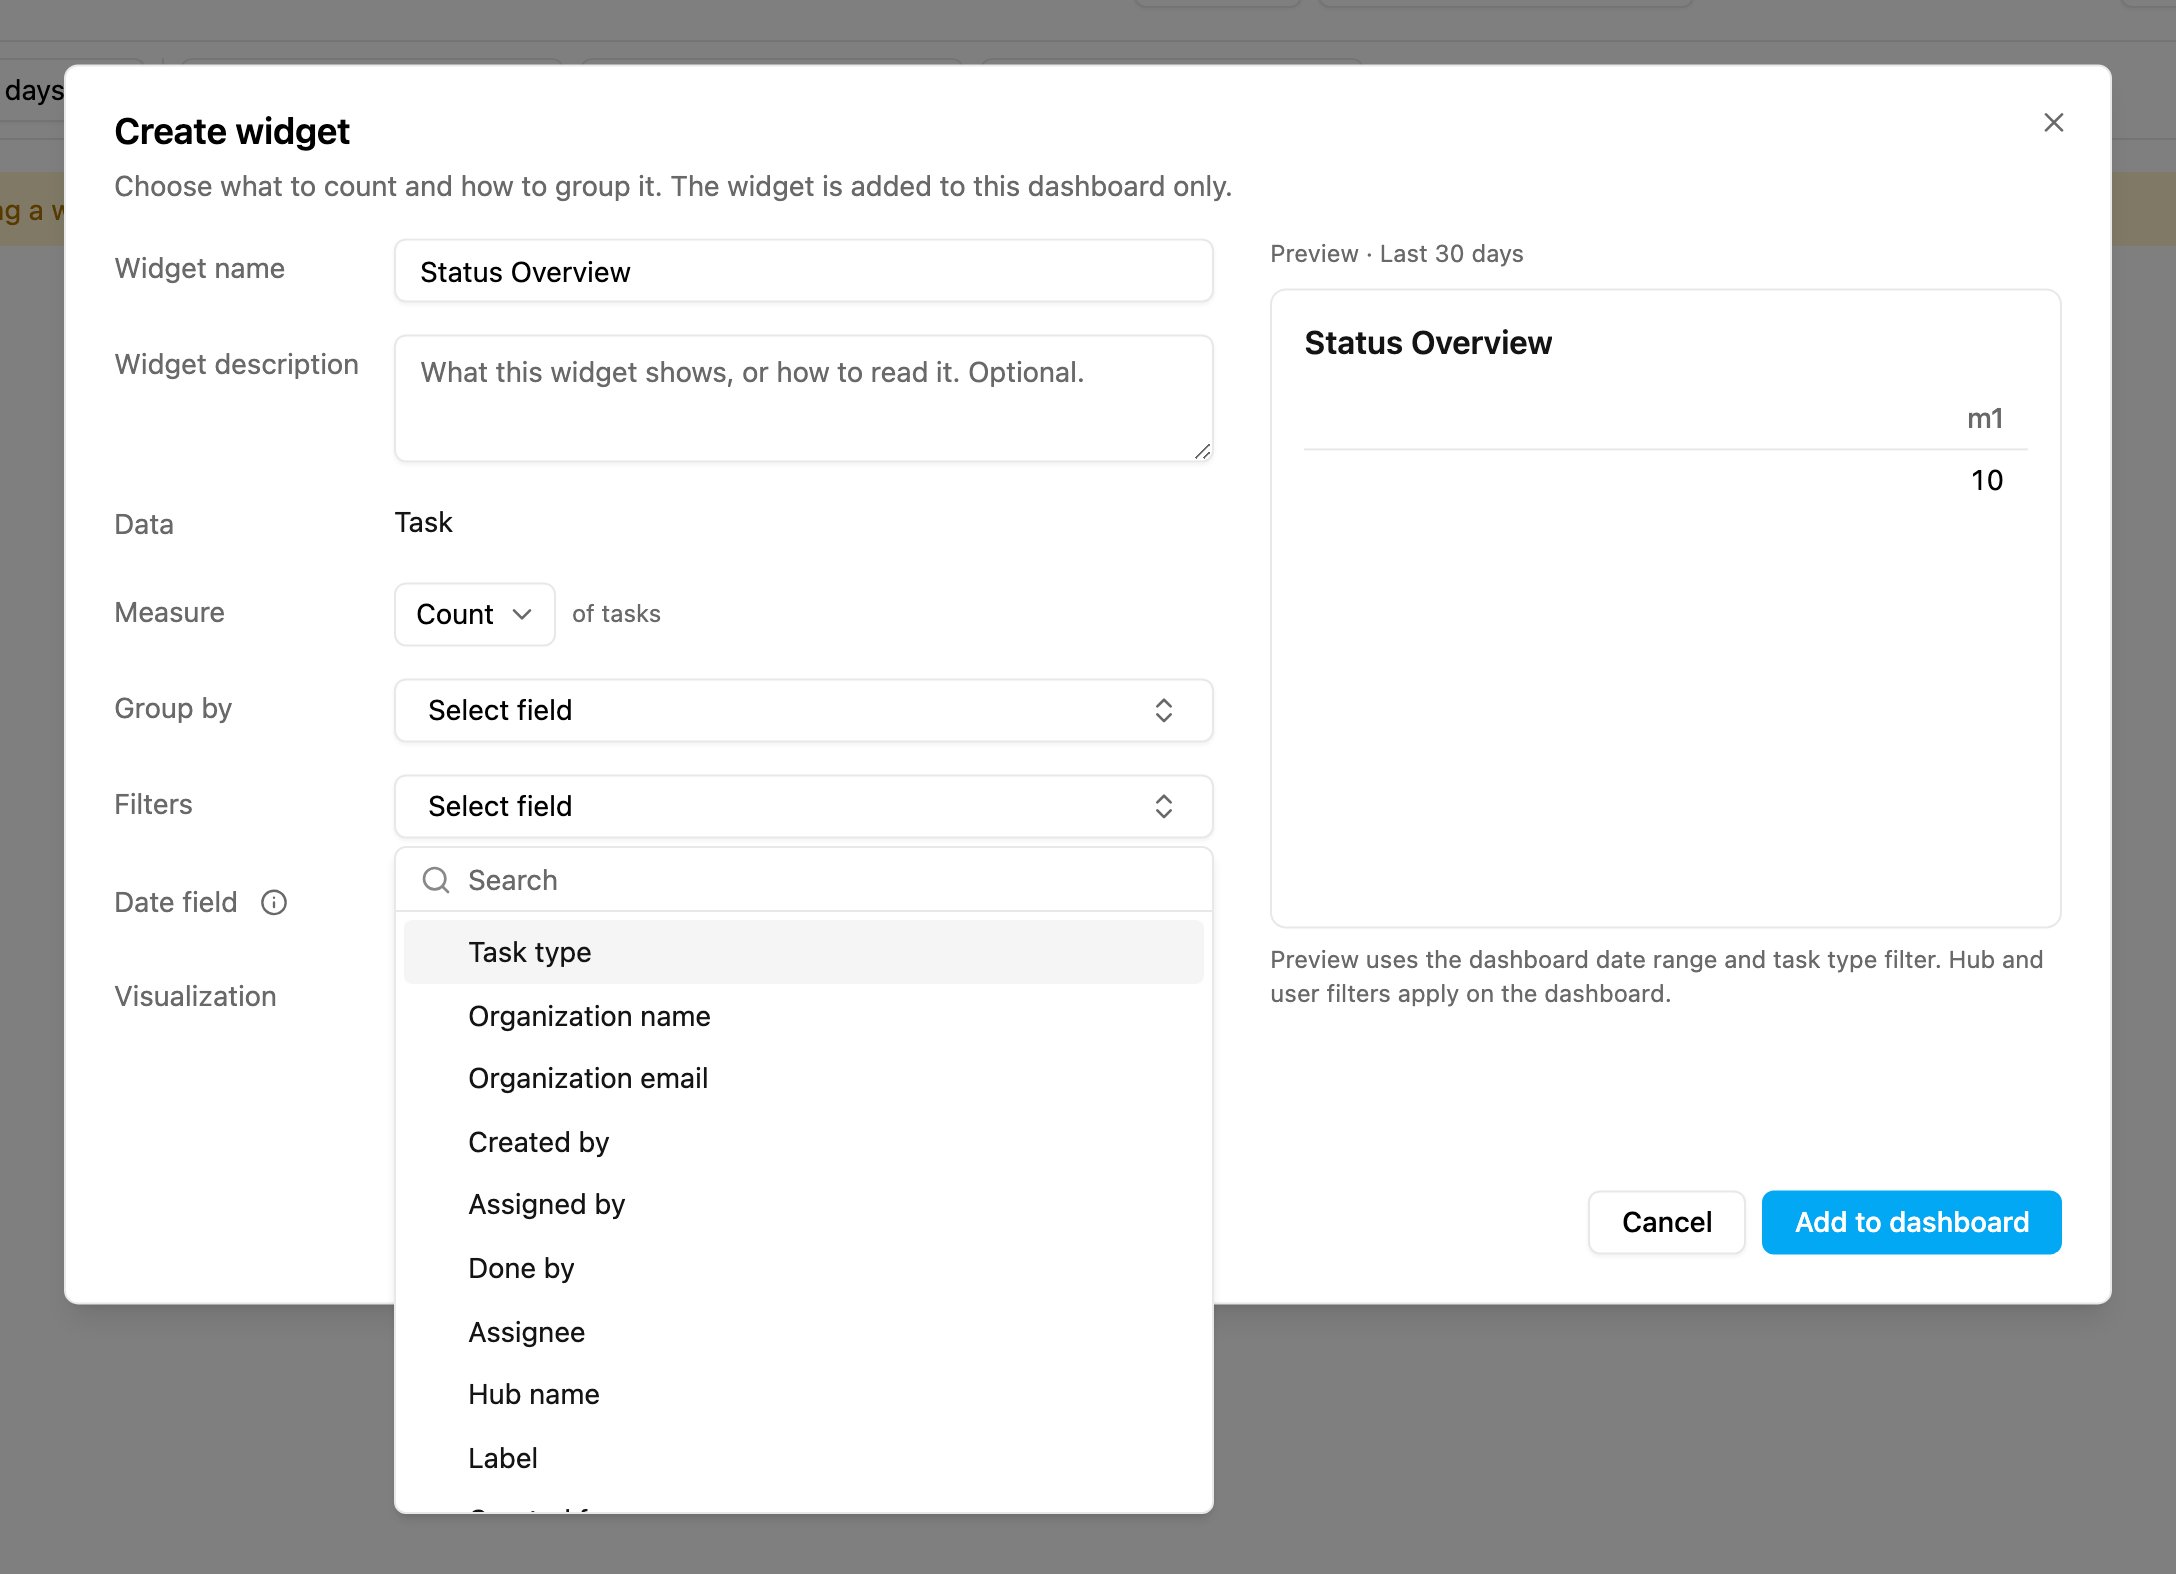
The Create widget dialog: one empty grouping row and one empty filter row, with Task type offered as a filter field.
* **Widget name**: the title on the widget. Required, up to 200 characters. * **Widget description**: up to 500 characters. Optional. It shows in a tooltip on the info icon next to the widget title. Text that is too long is refused with a message when you click **Add to dashboard**. * **Data**: always **Task**. A widget reads all your tasks unless you narrow it with a filter. * **Measure**: what to count. **Count** counts tasks. **Distinct count**, **Average**, **Sum**, **Minimum** and **Maximum** ask for a **Field** as well. * **Group by**: the dialog opens with one empty grouping row. Pick a field to split the result; once the row is filled, **Add grouping** appears for a second one (two at most). A field such as **Hub name** has a **Number of groups** (**Top 5**, **Top 10**, **Top 20** or **Top 50**). A date field has an **Interval**: **Per hour**, **Per day**, **Per week** or **Per month**. Remove a grouping with **×**. An empty row is ignored. * **Filters**: optional. The dialog opens with one empty filter row; once it is filled, **Add filter** appears for another. Use a filter to count only some tasks, for example **Status** *is one of* **Done**, or **Task type** *is one of* **Delivery**, **Pickup**. Remove a filter with **×**. An empty row is ignored. Without a **Task type** filter the widget counts tasks of every task type. Only task types of your organization are accepted. * **Date field**: the date that decides which tasks fall in the time range, for example **Start time** or **Done time**. Point at the info icon next to **Date field** to see which range applies now. * **Visualization**: how to draw the result. A visual that cannot show your settings is greyed out; point at it to see why. For example, a single number cannot show a grouped result. A new widget starts on **Table**. Click **Add to dashboard**. The widget is saved right away as a [widget template](/pages/analytics/dashboard/widget-templates) of your organization, and the app says *"(name)" saved as a widget template and added to the dashboard*. Everyone in your organization can now add it to other dashboards. The widget template stays even if you click **Discard** instead of saving the dashboard. The widget appears at the end of the dashboard. Click **Save** to keep it on this dashboard: the dashboard gets its own copy of the widget, so changing it here later, for example with **Edit query**, never changes the widget template, and changing the widget template never changes this widget. ### Time range and dashboard filters A custom widget has no time range of its own. On the dashboard it follows the dashboard's time range and filters like any other widget. The tooltip on the **Date field** info icon says which range it uses now, for example *The time range comes from the dashboard filter (now: Last 30 days).* The dashboard's **Task Types** filter is combined with the widget's own **Task type** filter, if it has one. If the two have no task type in common, the widget shows its usual empty state. ### Preview The **Preview** shows the widget with your dashboard's current data, and updates a moment after you stop changing settings. Its first line names the time range it uses, for example *Preview · Last 30 days*. The preview uses the dashboard's time range, the widget's own filters and the dashboard's **Task Types** filter. Hub and assignee filters are not used in the preview, but they apply once the widget is on the dashboard. The note under the preview says so: *Preview uses the dashboard date range and task type filter. Hub and user filters apply on the dashboard.* * *Finish every grouping and filter to see a preview.*: a grouping or filter is only partly filled, for example a filter field with no value. * *This widget's query can't be saved. Change or remove the widget and try again.*: the settings would make the query too large, for example **Per hour** split by 50 hubs over a month. The setting to change is marked *Check this setting.* Pick a larger interval or fewer groups. **Add to dashboard** is never disabled. If something is missing when you click it, nothing is added: each setting to fix is marked, for example *A widget needs a name.* or *Choose a field to group by.*, and the cursor moves to the first one. The widget needs a name, a description no longer than 500 characters, a complete grouping and filter, and a visual that can show the result.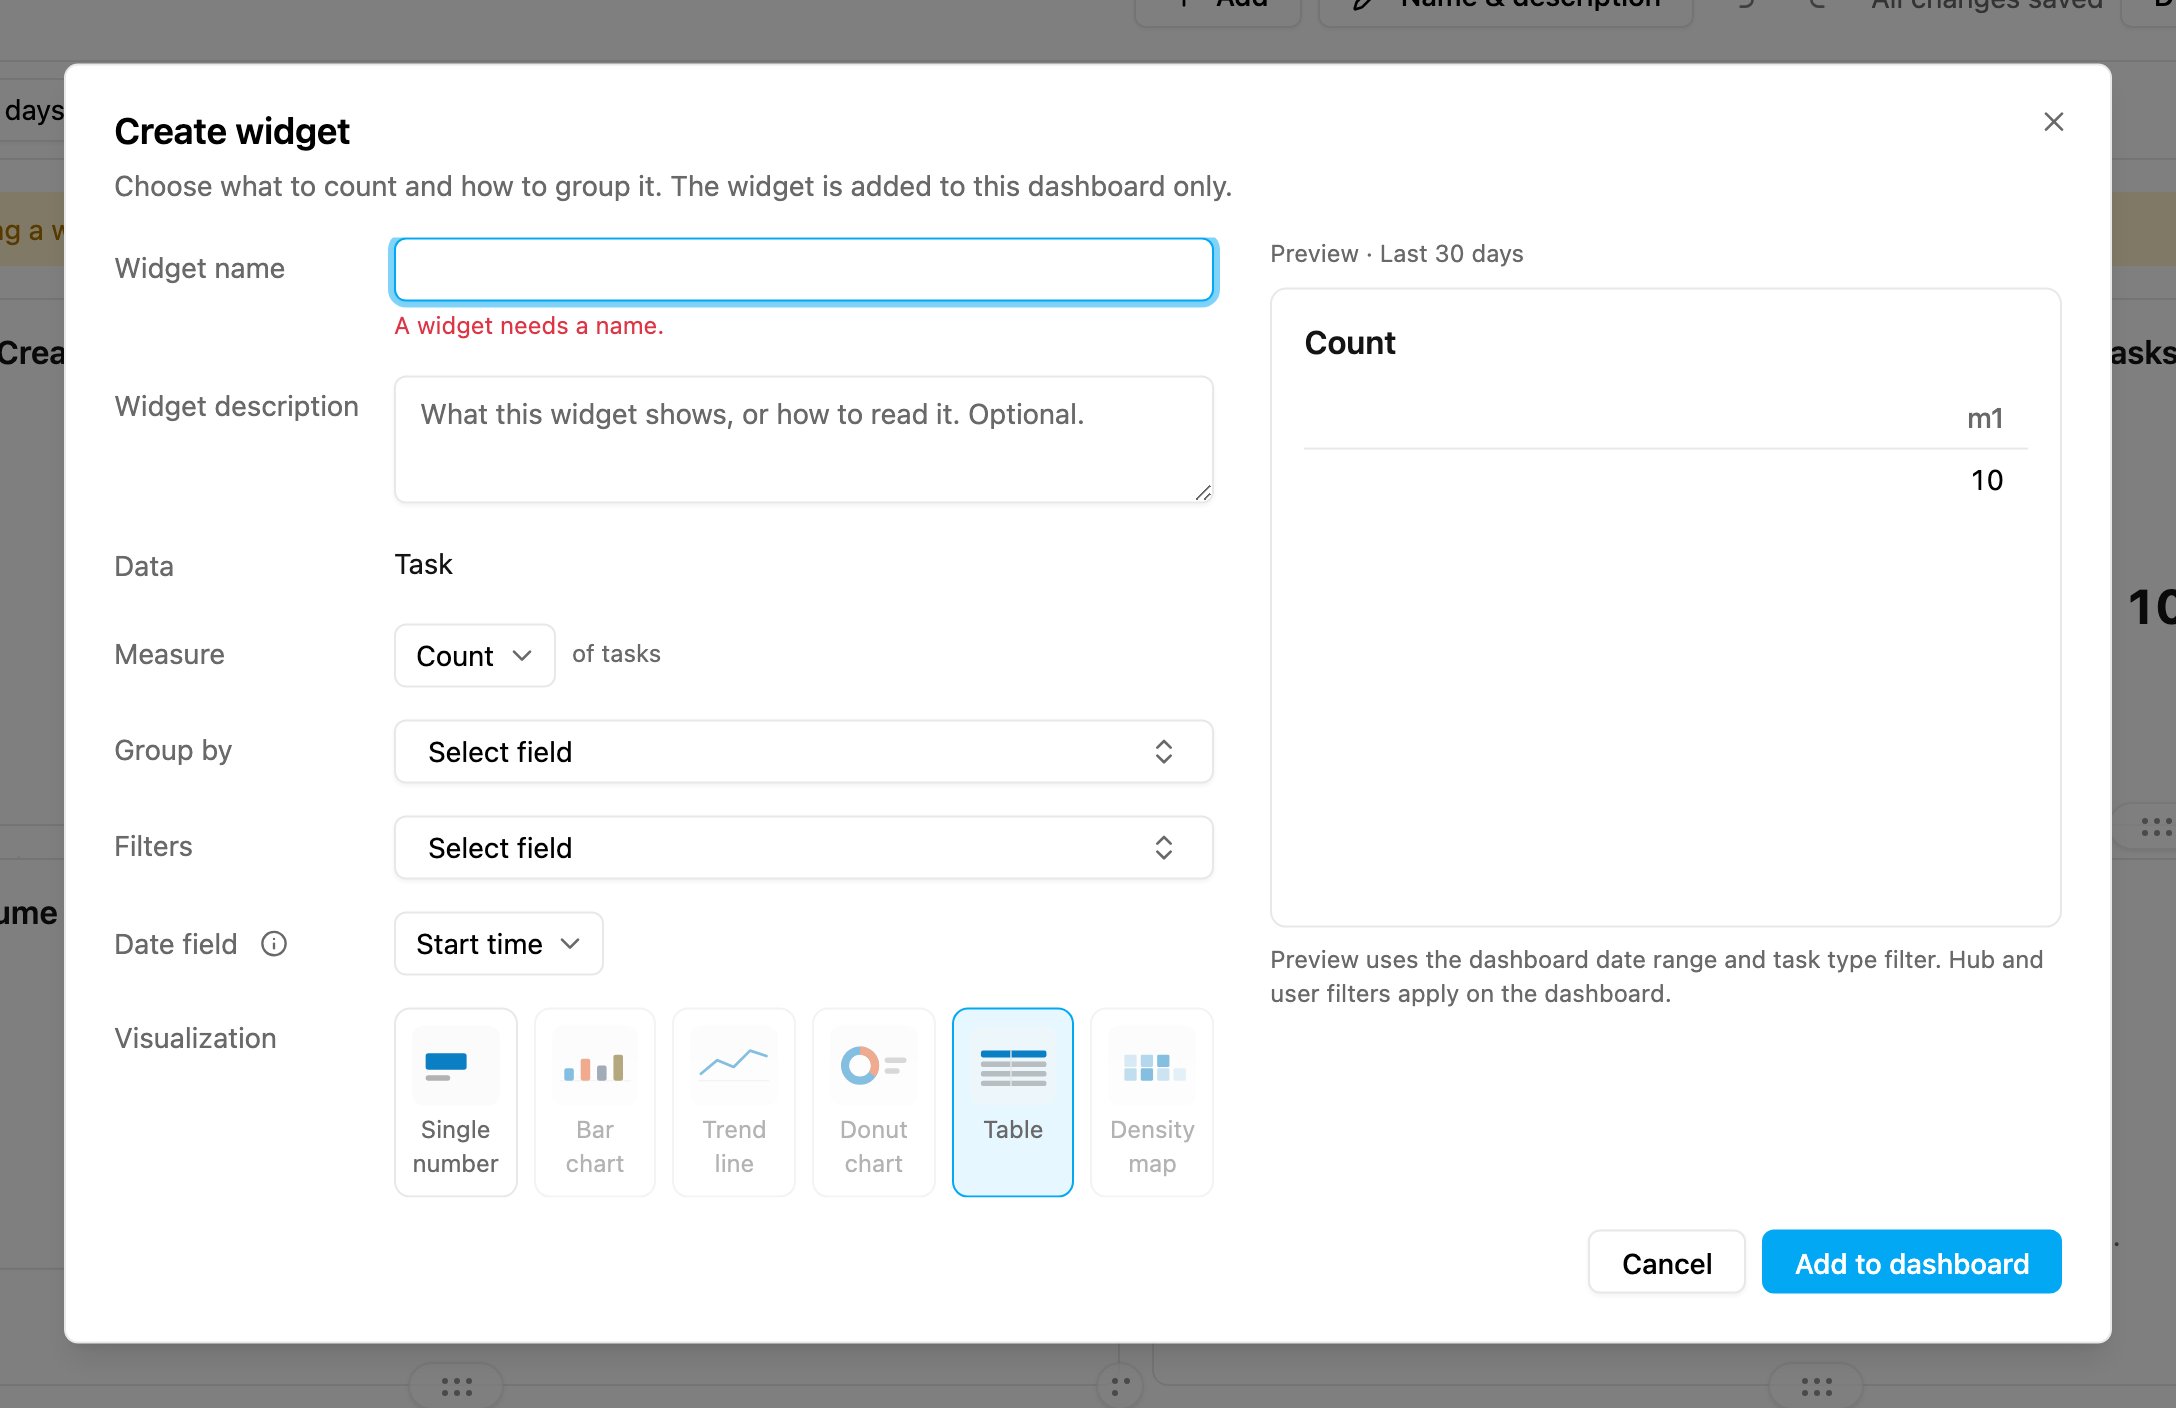
Clicking Add to dashboard with no name marks the field: A widget needs a name.
## Edit a widget's query You can change what a widget counts, not just its name. 1. In edit mode, click the widget's **⋯** and choose **Edit query**. 2. The **Edit widget query** dialog opens with the widget's current settings and its saved visual. 3. Change what you need and click **Apply changes**. 4. Click **Save** to keep the change, or **Discard** to drop it. **Edit query** is offered for widgets that count tasks. It is not offered for **Free text**, **Banner** or **User by Status** widgets, or for a widget built on data other than tasks. **Apply changes** follows the same rules as **Add to dashboard**. A widget's task types appear as a **Task type** row under **Filters**. If a task type in it has since been deleted, it is marked *(deleted)* and you can still apply your changes; only a task type you add is checked against your organization. Some widgets use settings the dialog cannot change. Those settings are shown with *Kept as it is. You can only remove it.* and are saved unchanged unless you remove them. If the widget had its own time range, the dialog says *This query had its own time range. It now follows the dashboard filter.* The change applies to this dashboard only. ## Density map A location grouping, such as **Done coordinate (map)**, can only be drawn as a **Density map**. A density map counts tasks and has no second grouping. This documentation is built and hosted on [Mintlify](https://mintlify.com), a developer documentation platform.