> ## Documentation Index
> Fetch the complete documentation index at: https://docsv4.mile.app/llms.txt
> Use this file to discover all available pages before exploring further.
# Dashboard Templates
> Start a dashboard from a ready layout and change any widget afterwards.
Every new dashboard starts from a **template**: a ready layout of widgets. Pick the one closest to what you want to watch, then add, move or remove widgets as you like. Changing a dashboard never changes its template.
Required permission:
* Add dashboard
## Create a dashboard
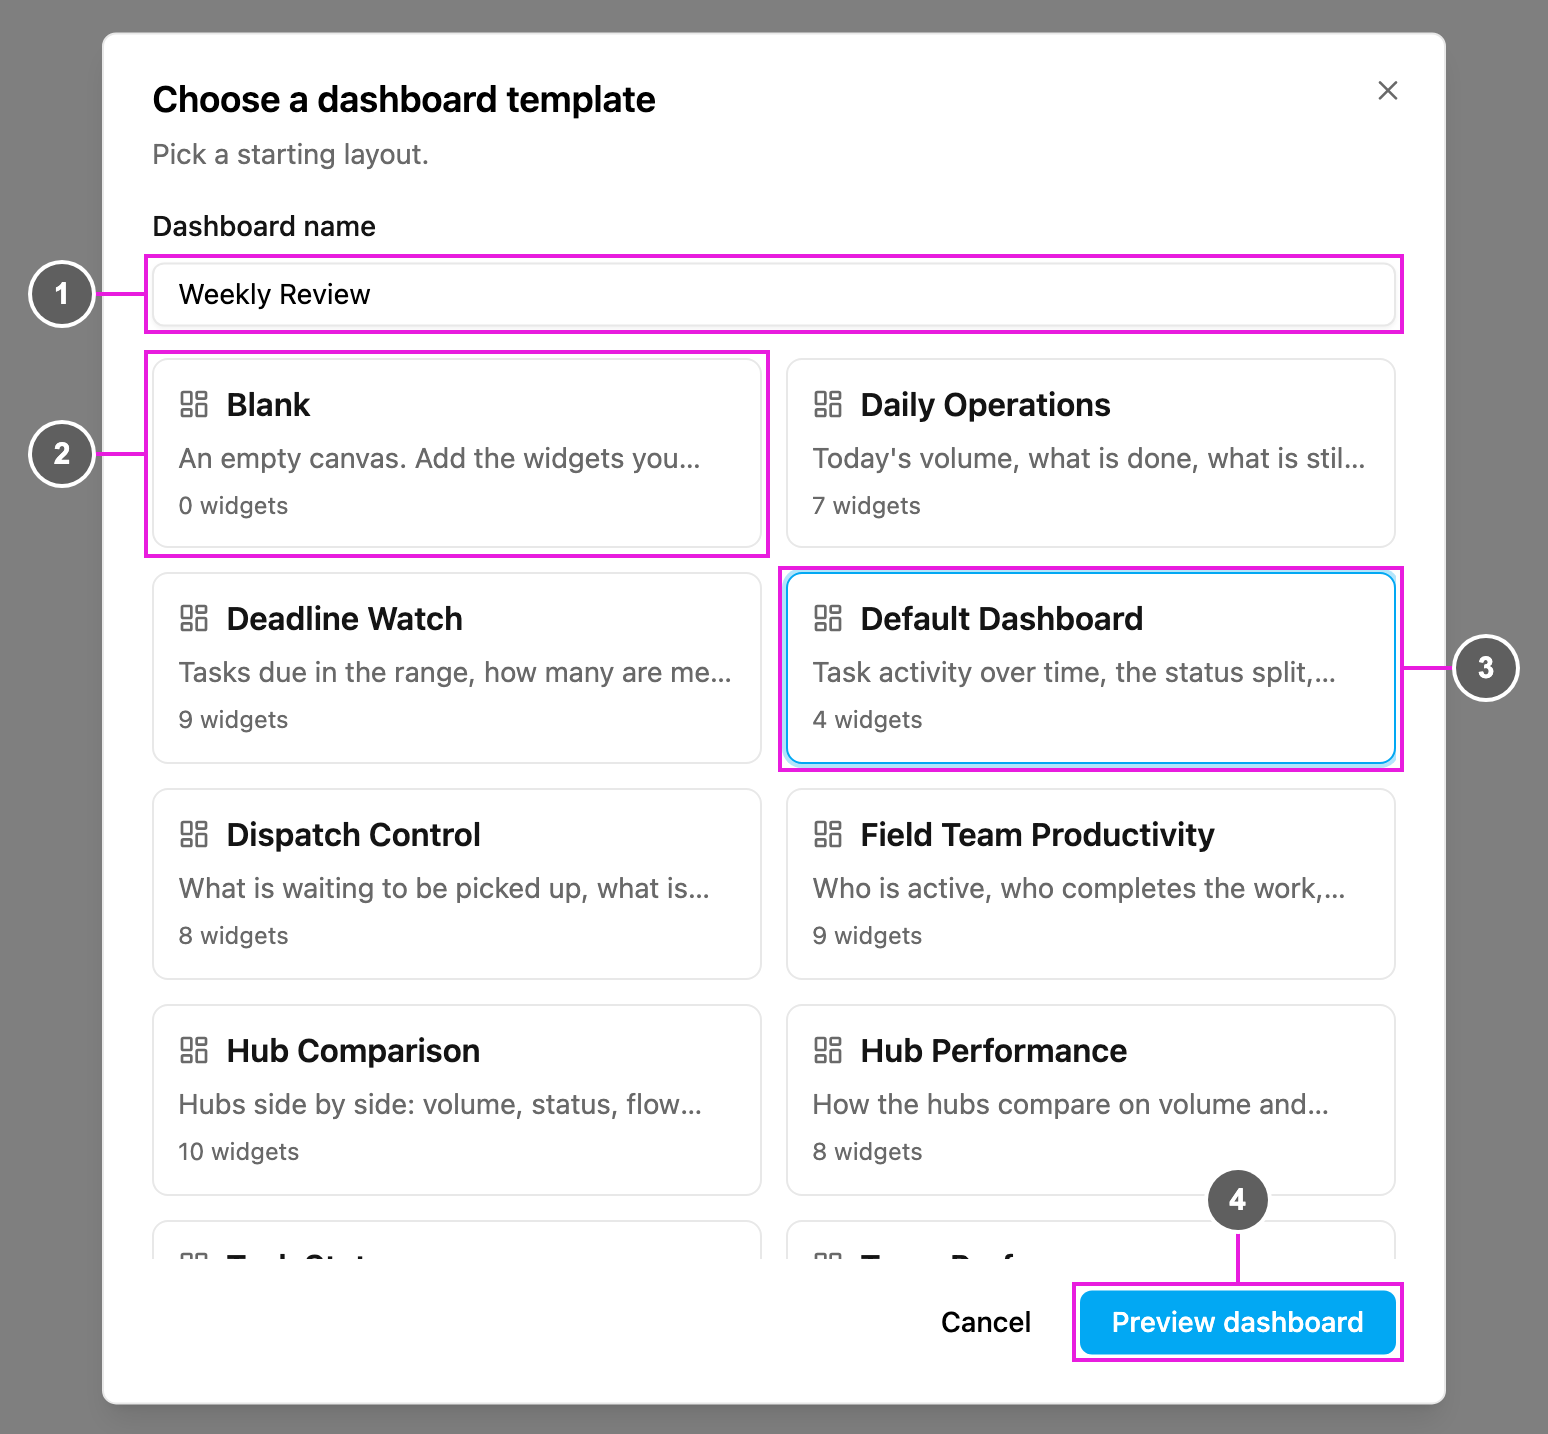
1. Open **Analytics › Dashboard** and click **New**.
2. Type a **Dashboard name**.
3. Click a template.
4. Click **Preview dashboard**.
1. **Dashboard name**: the name shown in the dashboard list, for example *Morning operations*.
2. **Blank**: an empty canvas, to add only the widgets you want.
3. **Selected template**: the template you picked. Each card shows the template's name, what it is for and how many widgets it has. **Default Dashboard** is picked when the dialog opens.
4. **Preview dashboard**: open the layout with your own numbers.
The preview is **not saved yet**. A *Not saved* banner says so. Drag and resize widgets, add or remove some, then click **Save** to create the dashboard. If you leave or click **Discard**, nothing is added to your dashboards. See [Editing a Dashboard](/pages/analytics/editing-a-dashboard).
A new dashboard is private. Only you can see it until you share it.
## Templates
| Template | What it is for | Widgets |
| - | - | - |
| **Blank** | An empty canvas. Add the widgets you want. | No widgets. |
| **Daily Operations** | Today's volume, what is done, what is still open. | Total Tasks, Completed Tasks, Active Tasks, Unassigned, Tasks by Status, Tasks by Flow, Volume Trend |
| **Deadline Watch** | Tasks due in the range, how many are met, and where overdue work is piling up. | Tasks Due in Range, Due and Completed, Due and Still Open, Overdue Open Tasks, Deadlines per Day, Overdue Open Tasks by Hub, Overdue Tasks per Assignee, Due and Open by Hub, Overdue Open Tasks by Flow |
| **Default Dashboard** | Task activity over time, the status split, per-user activity, and users by status. | Task Activity, Tasks by Status, User Activity, User by Status |
| **Dispatch Control** | What is waiting to be picked up, what is running late, and who is carrying the open work. | Unassigned, Overdue Open Tasks, Stalled Ongoing Tasks, Active Field Staff, Unassigned by Hub, Ongoing per Assignee, Tasks Assigned by Dispatcher, Open Tasks by Flow |
| **Field Team Productivity** | Who is active, who completes the work, and how much time goes into travel. | Active Field Staff, Staff Who Completed Tasks, Total Travel Time, Avg Travel Duration, Assignee Workload by Hub, Completions per Staff by Flow, Travel Duration per Assignee, Ongoing per Assignee, Hourly Completions |
| **Hub Comparison** | Hubs side by side: volume, status, task type mix, daily trend and travel duration. | Active Hubs, Total Tasks, Completed Tasks, Overdue Open Tasks, Status by Hub, Flow Mix by Hub, Daily Volume by Hub, Daily Completions by Hub, Travel Duration by Hub, Unassigned by Hub |
| **Hub Performance** | How the hubs compare on volume and completion. | Tasks by Hub, Completed by Hub, Total Tasks, Completed Tasks, Overdue Open Tasks, Active Hubs, Completion Trend, Task Location Heatmap |
| **Task Status** | The status split, plus completion per hub. | Tasks by Status, Ongoing, Done, Unassigned, Completed by Hub, Due and Still Open |
| **Team Performance** | Workload and completion per assignee. | Tasks by Assignee, Completed per Assignee, Tasks per Assignee, Avg Travel Duration, Active Field Staff |
| **Travel Time** | How long field staff spend travelling, in minutes, overall and per hub and task type. | Total Travel Time, Avg Travel Duration, Longest Travel Time, Tasks with Travel Time, Travel Duration Trend, Travel Duration by Hub, Travel Duration by Flow |
| **Weekly Review** | Week-by-week volume and completions, with the status split by task type and label. | New Tasks Created, Total Tasks, Completed Tasks, Overdue Open Tasks, Weekly Volume, Weekly Completions, Weekly Volume by Hub, Status by Flow, Status by Label, Completed by Label |
Widget names that say **Flow** count by task type. Every widget is described in [Dashboard Widgets](/pages/analytics/dashboard-widgets).
### Which template to start from
* **Daily Operations**: a morning check of today's volume and what is still open.
* **Deadline Watch**: whether tasks are finished before their end time, and where overdue work sits.
* **Default Dashboard**: the four charts of the previous version's task dashboard.
* **Dispatch Control**: for dispatchers, who need to see unassigned and stalled work and who carries the open tasks.
* **Field Team Productivity** and **Team Performance**: workload, completions and travel time per person.
* **Hub Comparison** and **Hub Performance**: hubs side by side, with a heat map of where tasks are done.
* **Task Status**: the status split and completion per hub.
* **Travel Time**: how long field staff spend travelling, per hub and task type.
* **Weekly Review**: week-by-week volume and completions, with status by task type and by label.
This documentation is built and hosted on [Mintlify](https://mintlify.com), a developer documentation platform.